My WEDC
Gateway to managing your resources and events
Gateway to managing your resources and events
Water Engineering and Development Centre
Please note: You will need to log in to your My WEDC account to download graphics – please sign up here if you don't already have an account.
Below are the graphics for WEDC Graphics: Infrastructure for all
Please click on the download link below your selected graphic to download it.
|

|
| ||
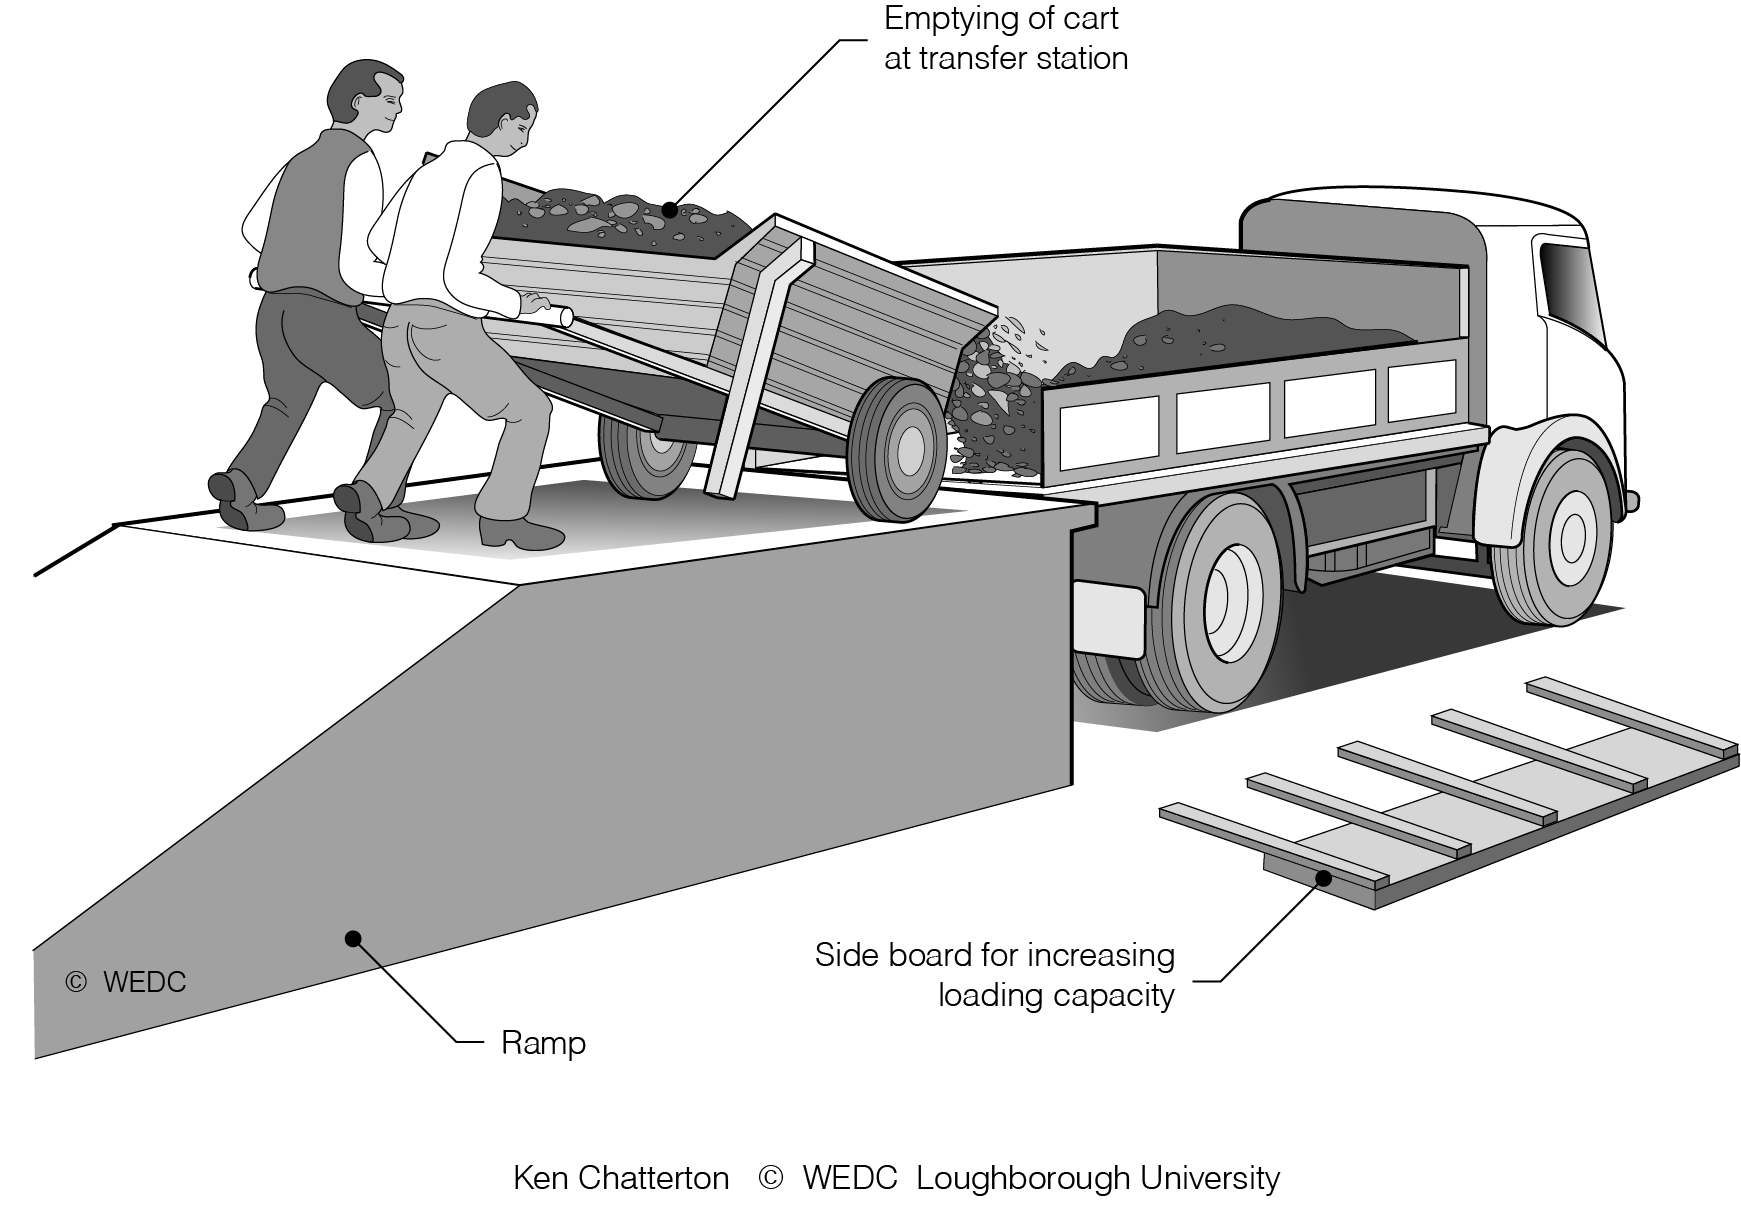
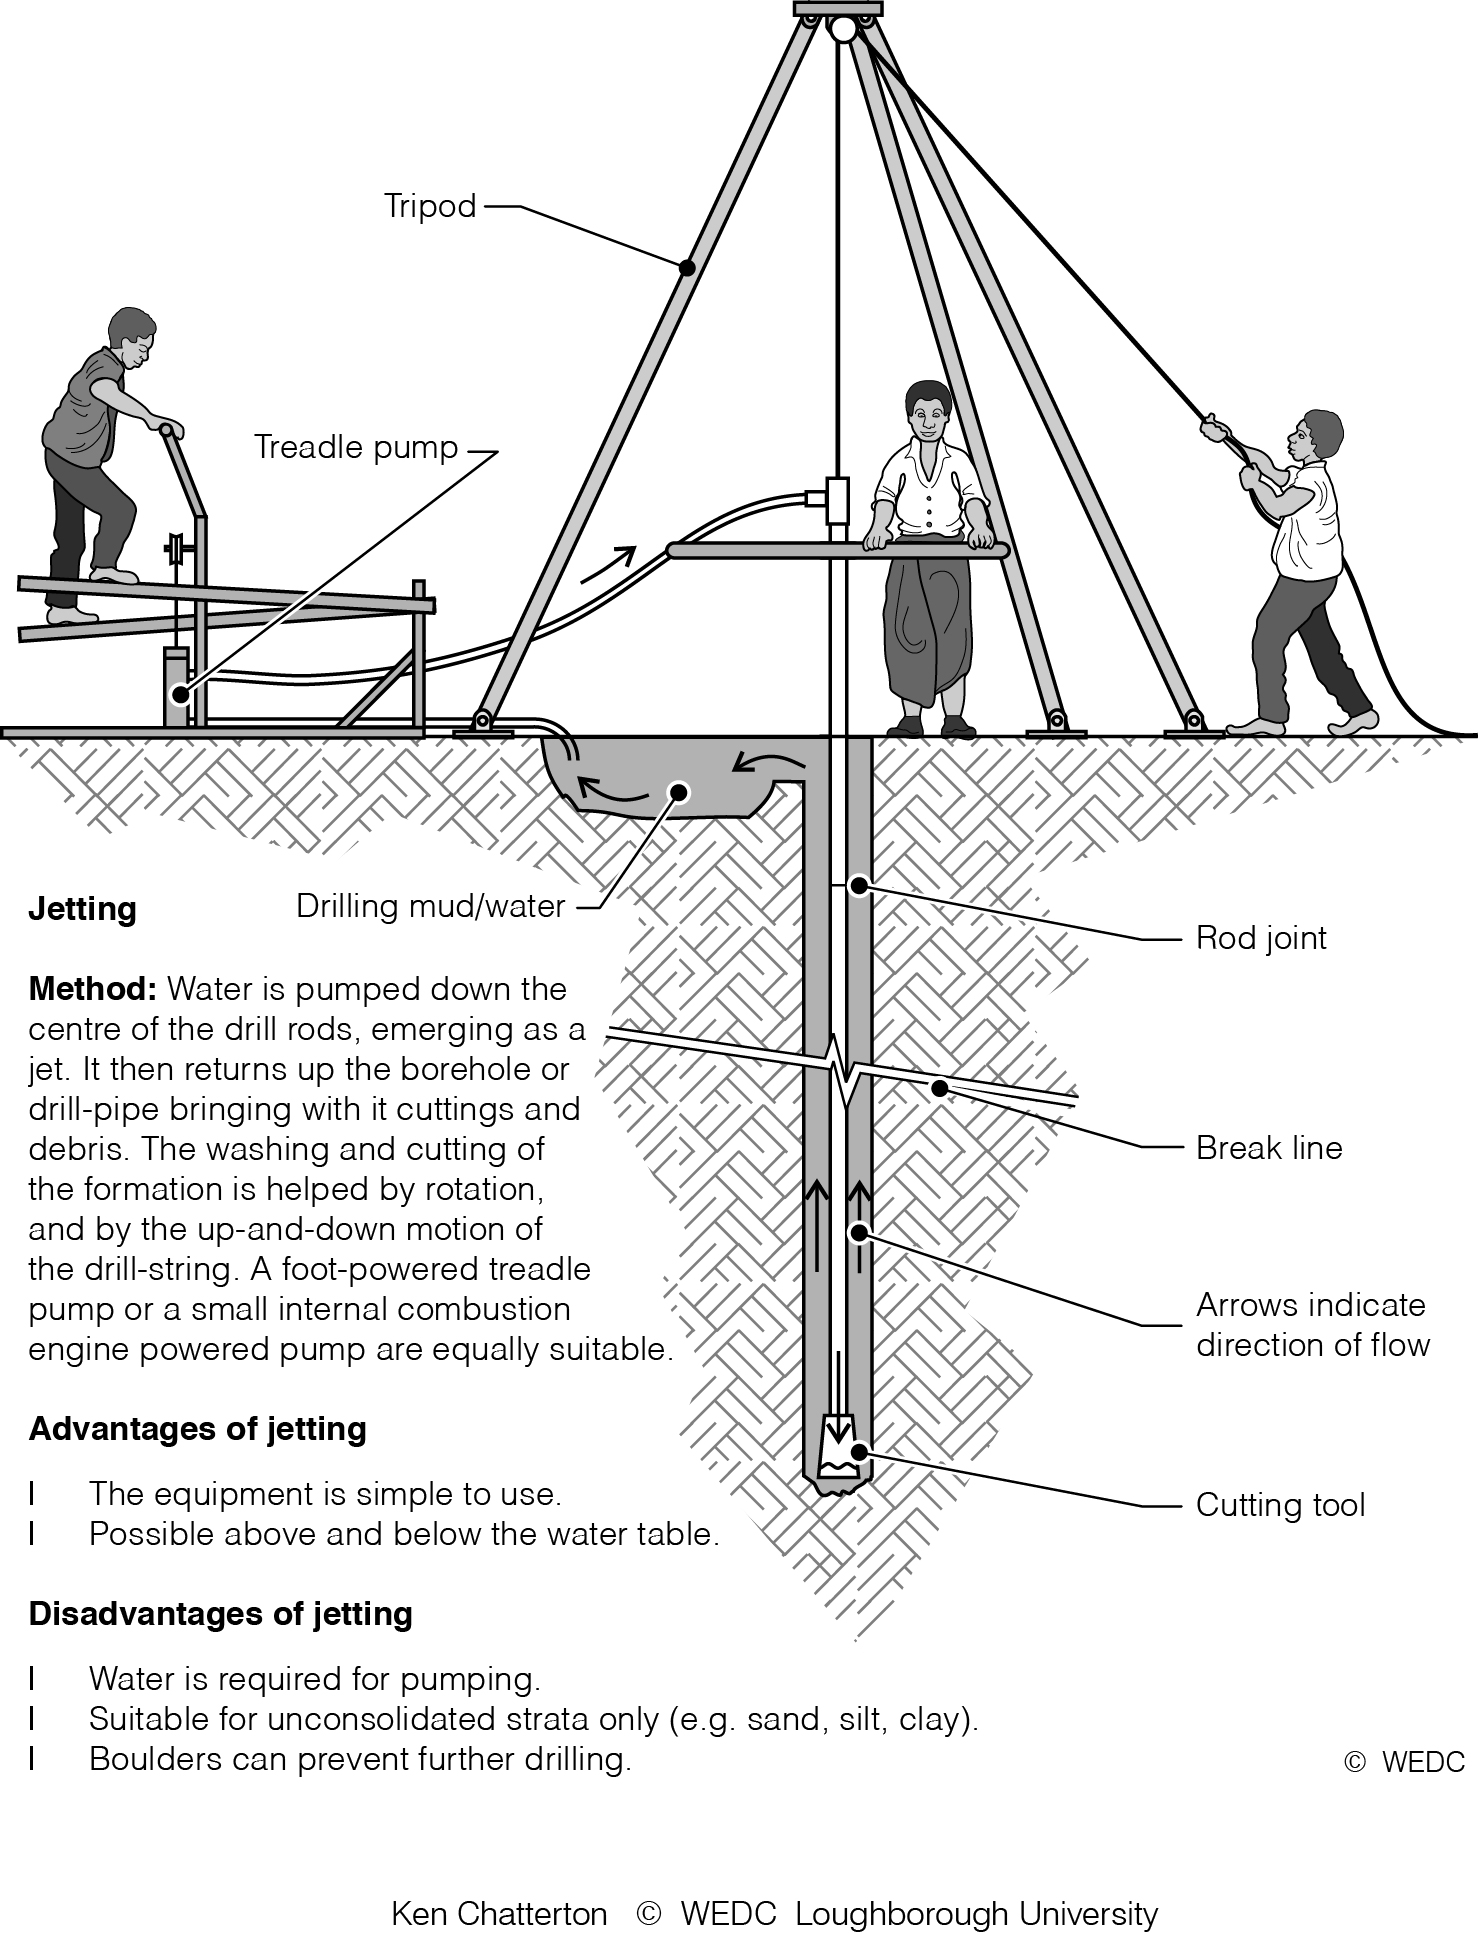
A waste transfer station | Infiltration trench - | Jetting | ||
|
|
| ||
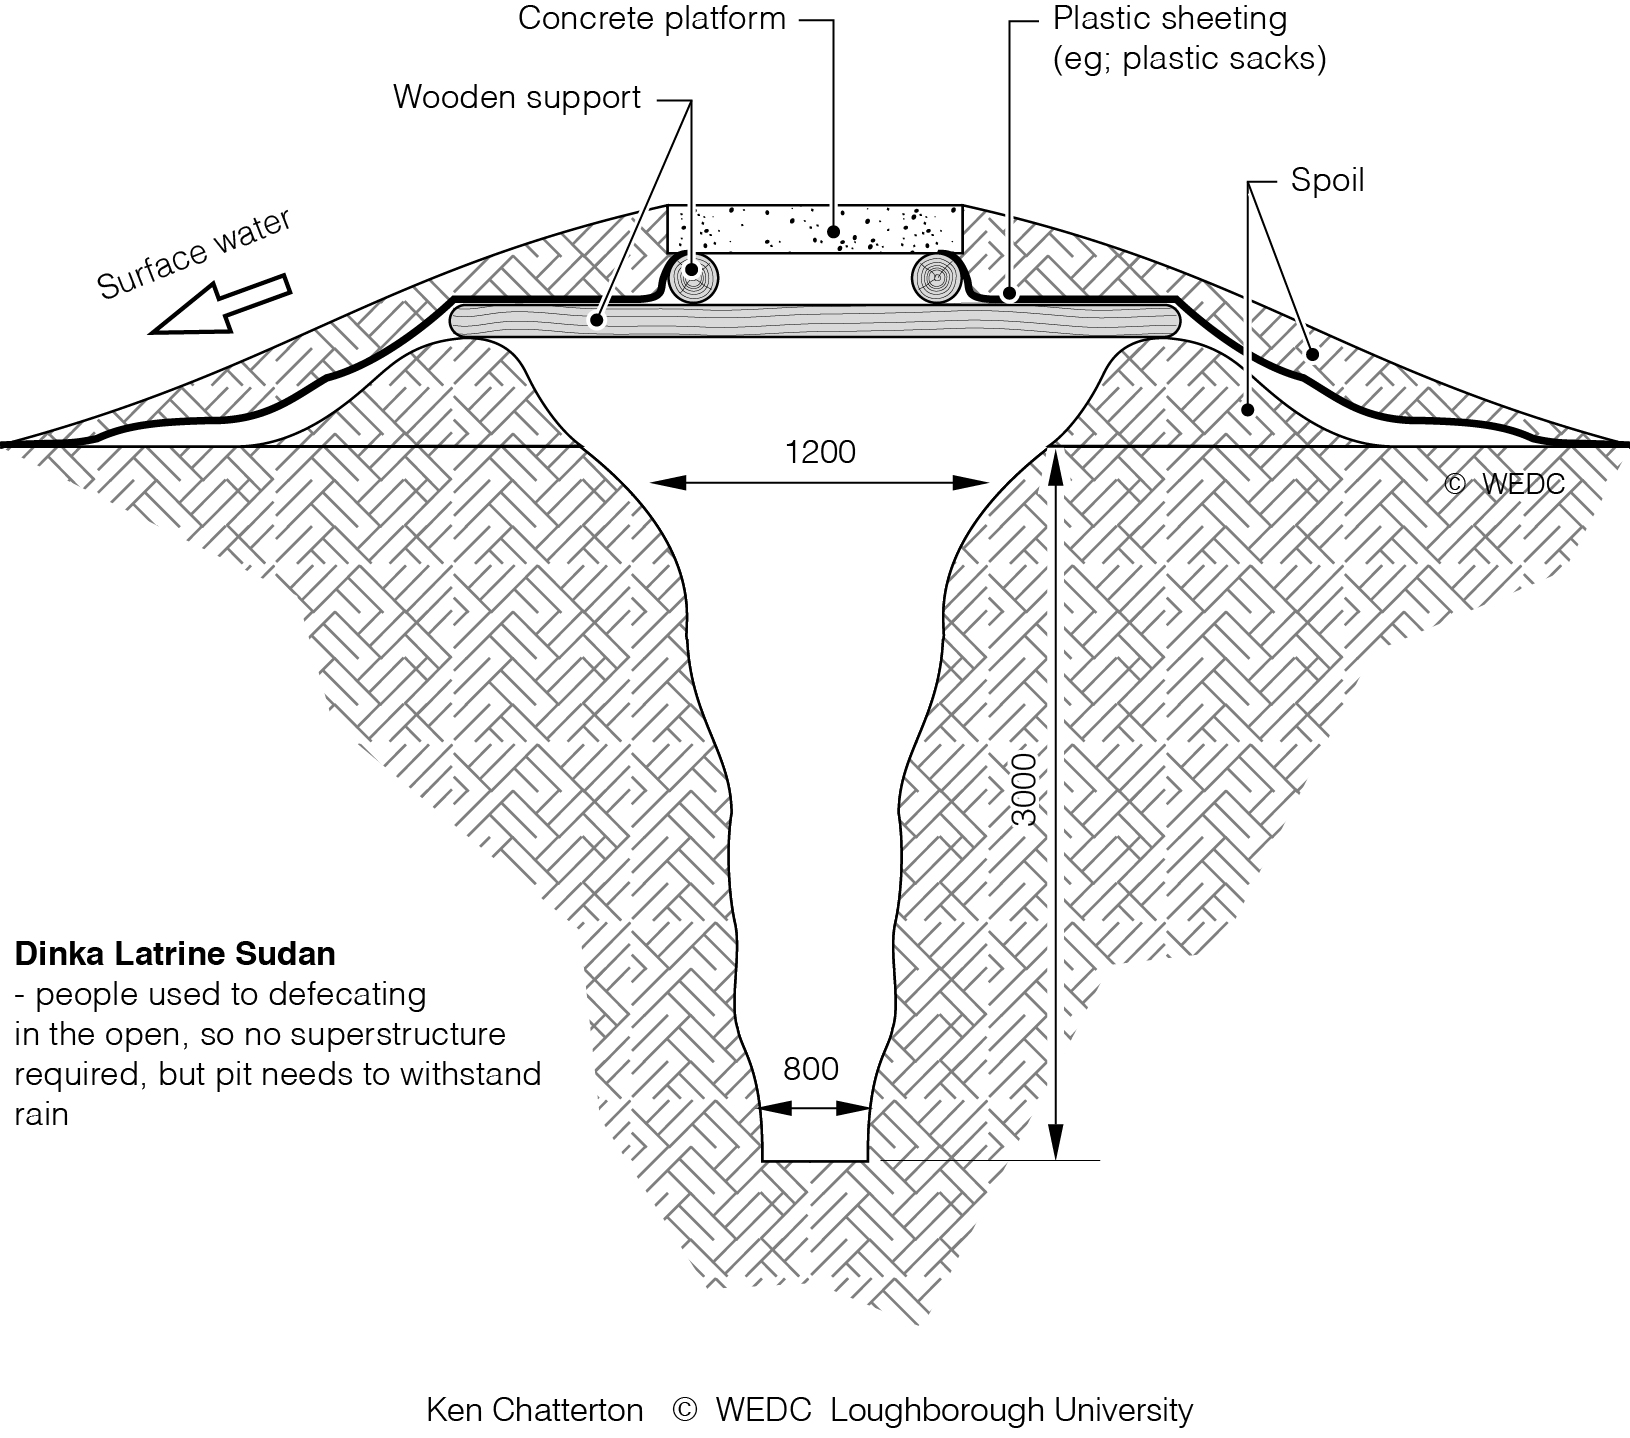
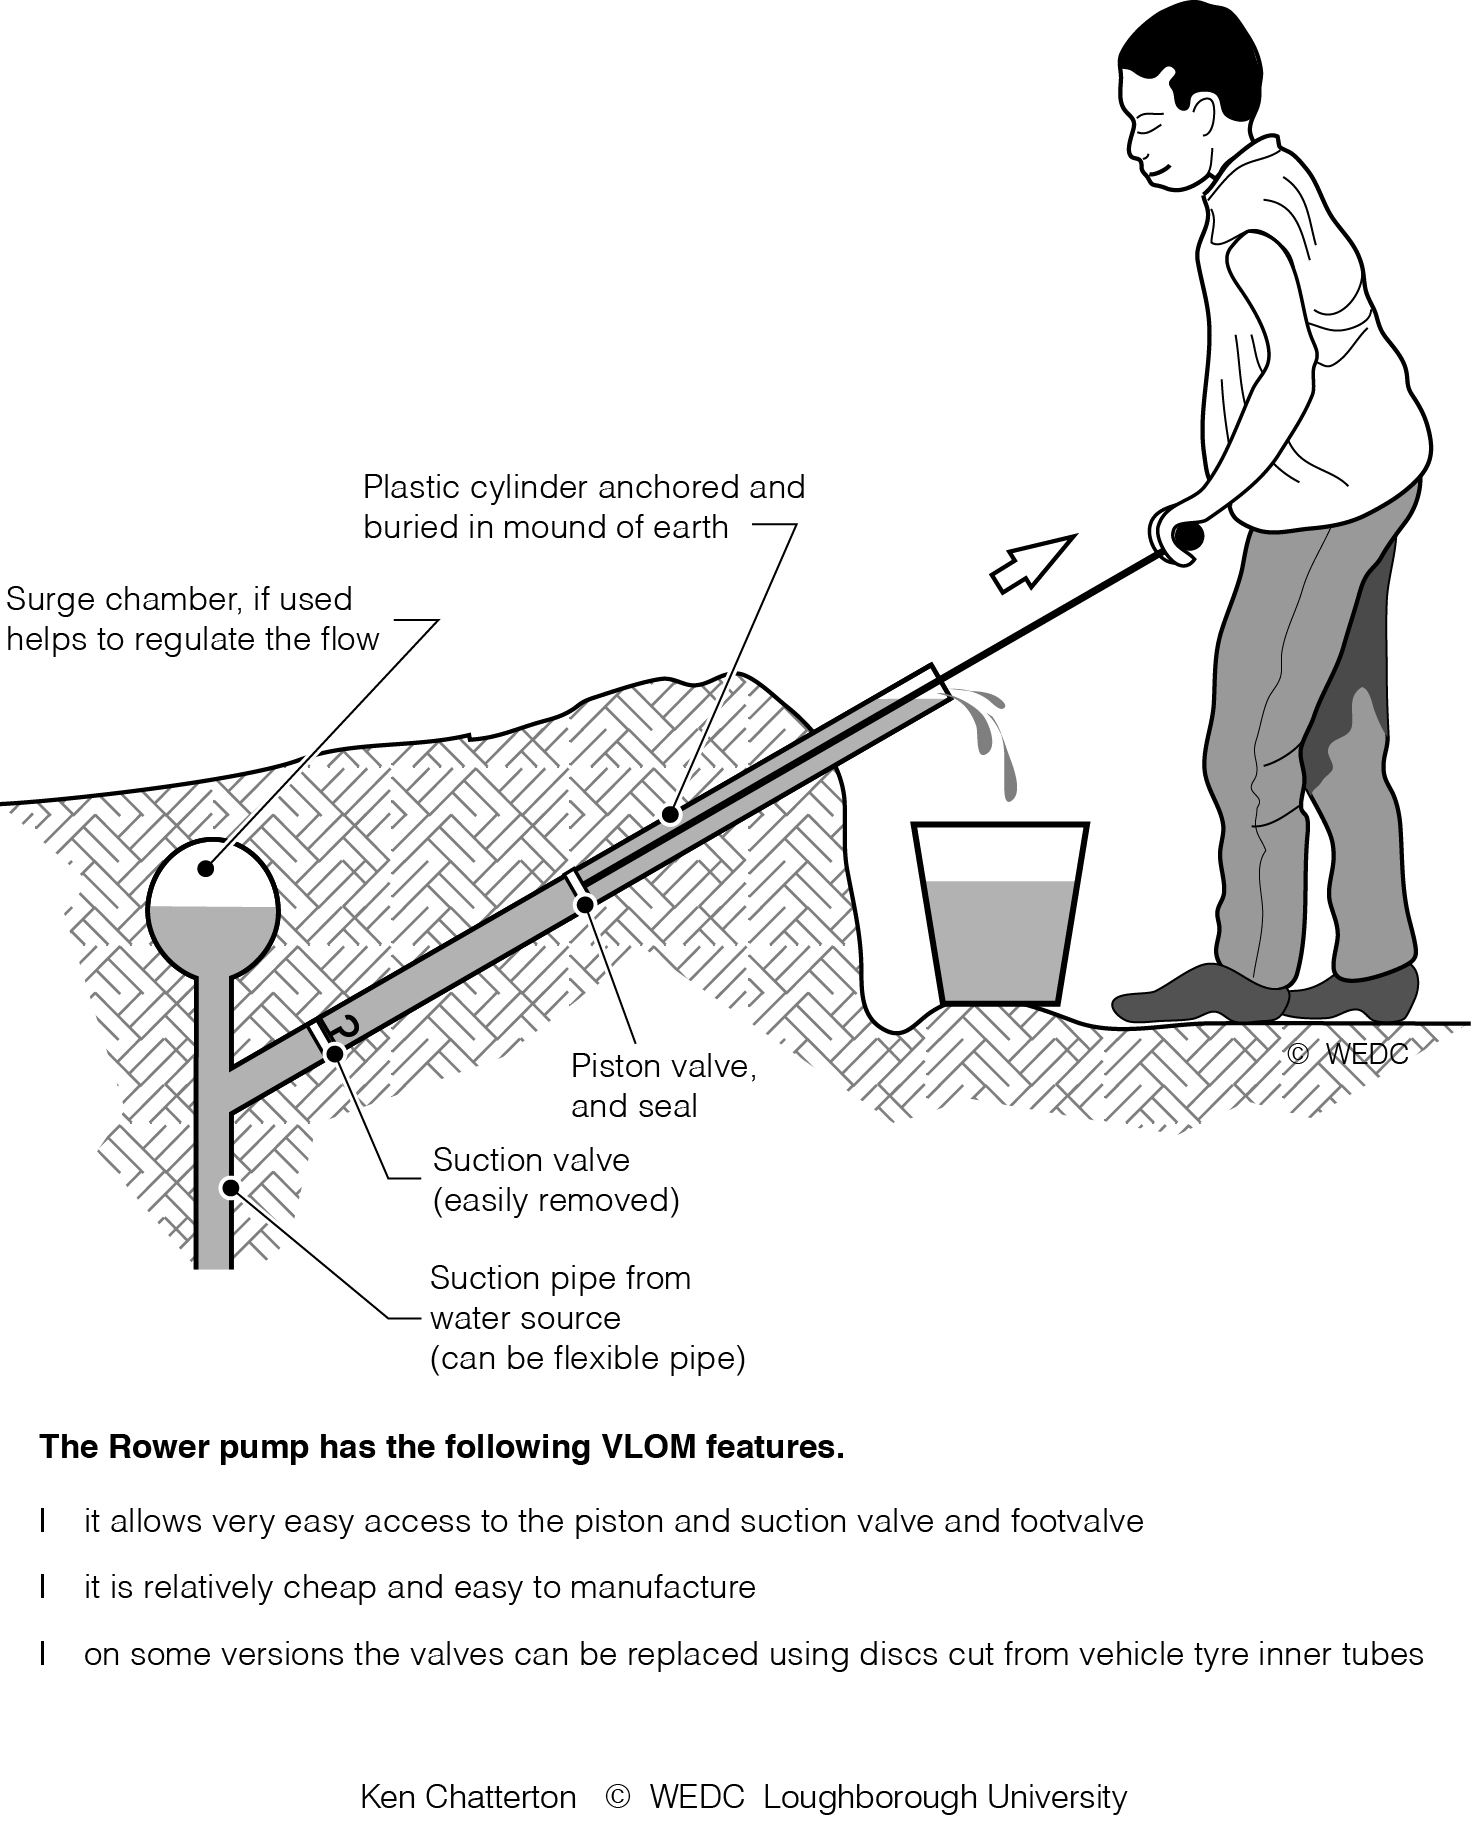
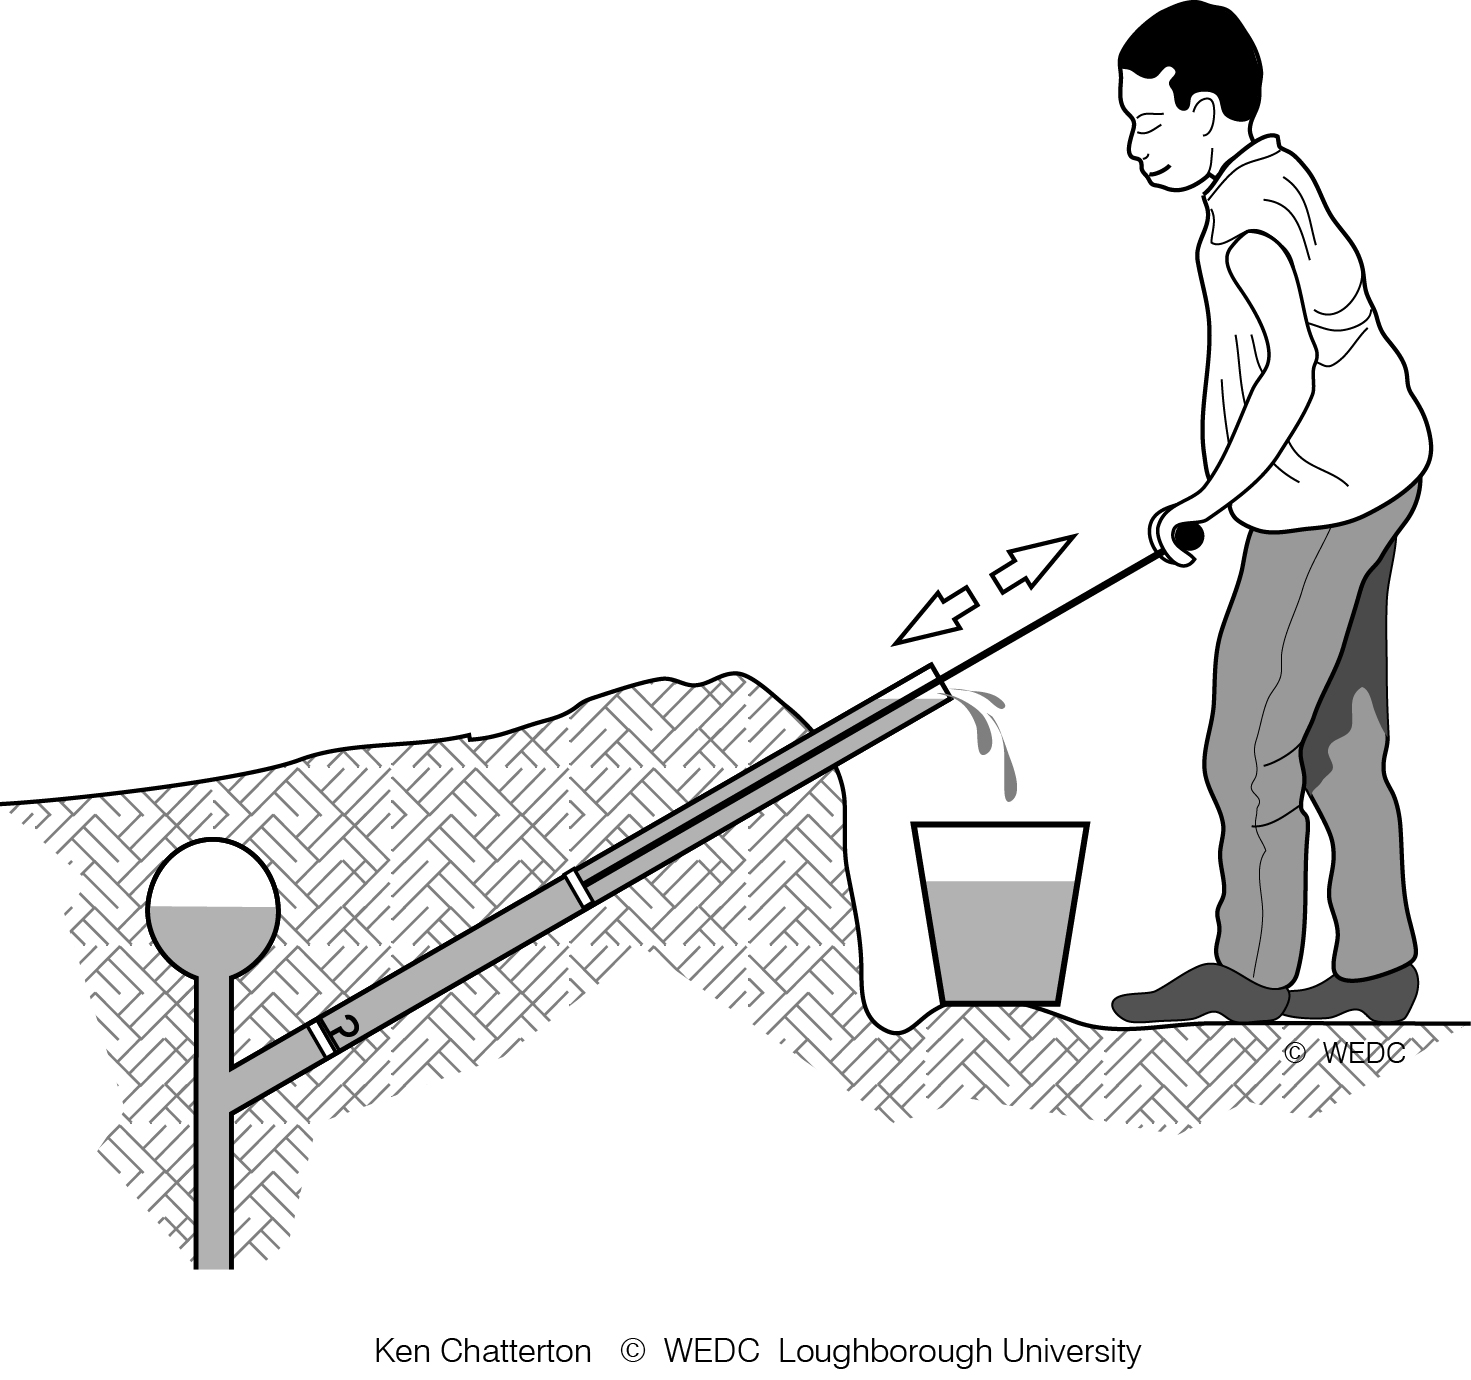
Latrine designed without superstructure | Rower pump - man standing | Rower pump - man standing without annotations | ||
|
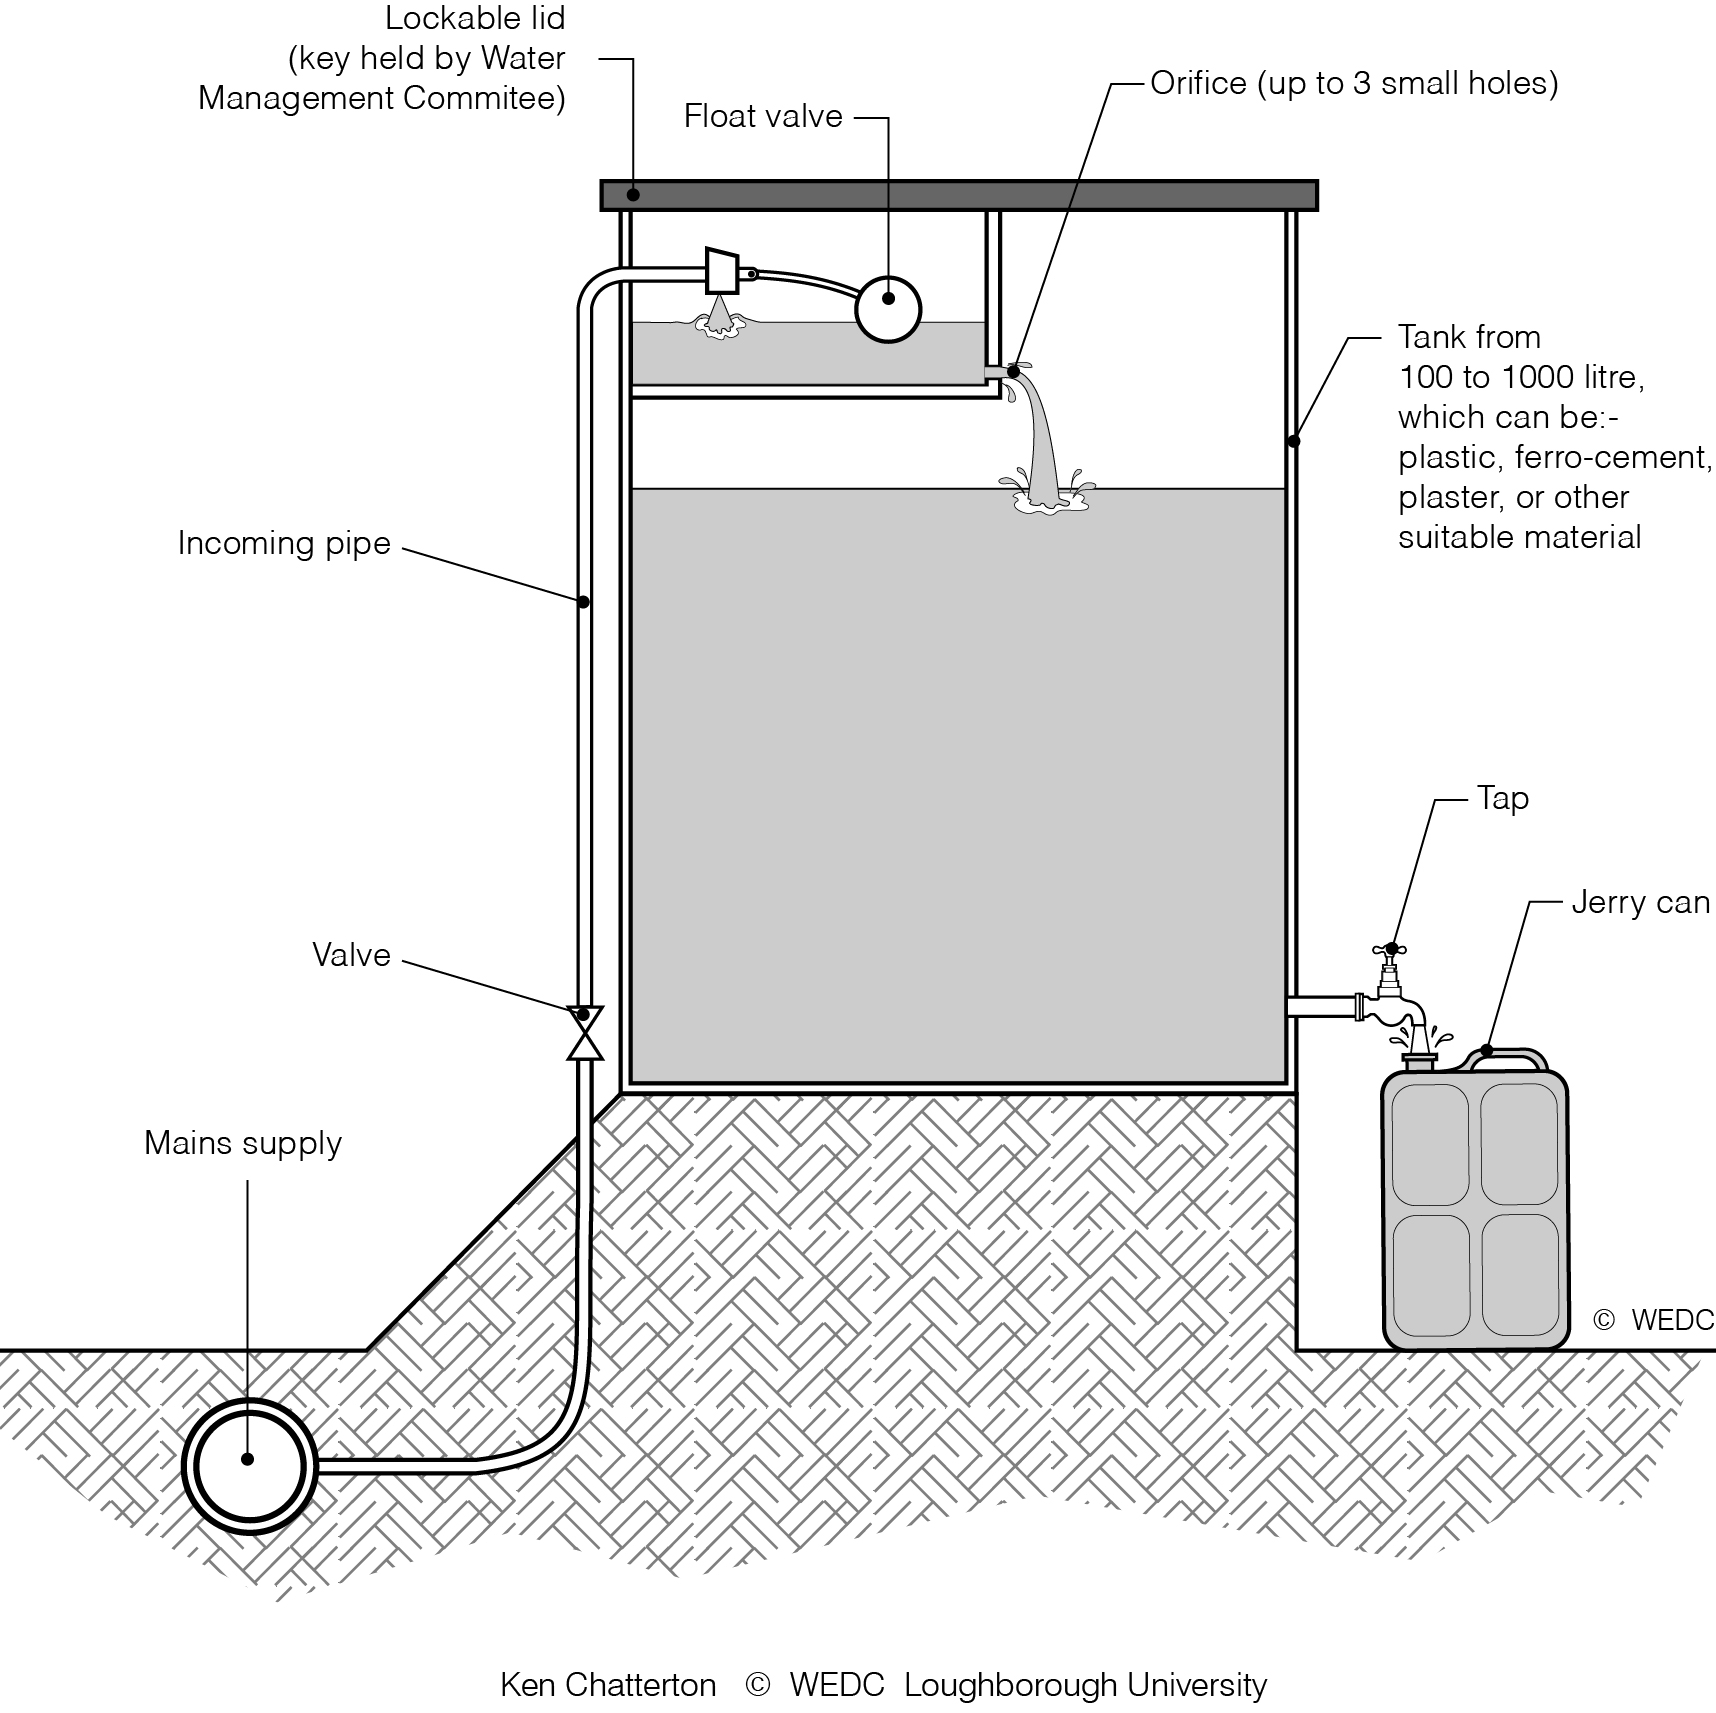
|
| ||
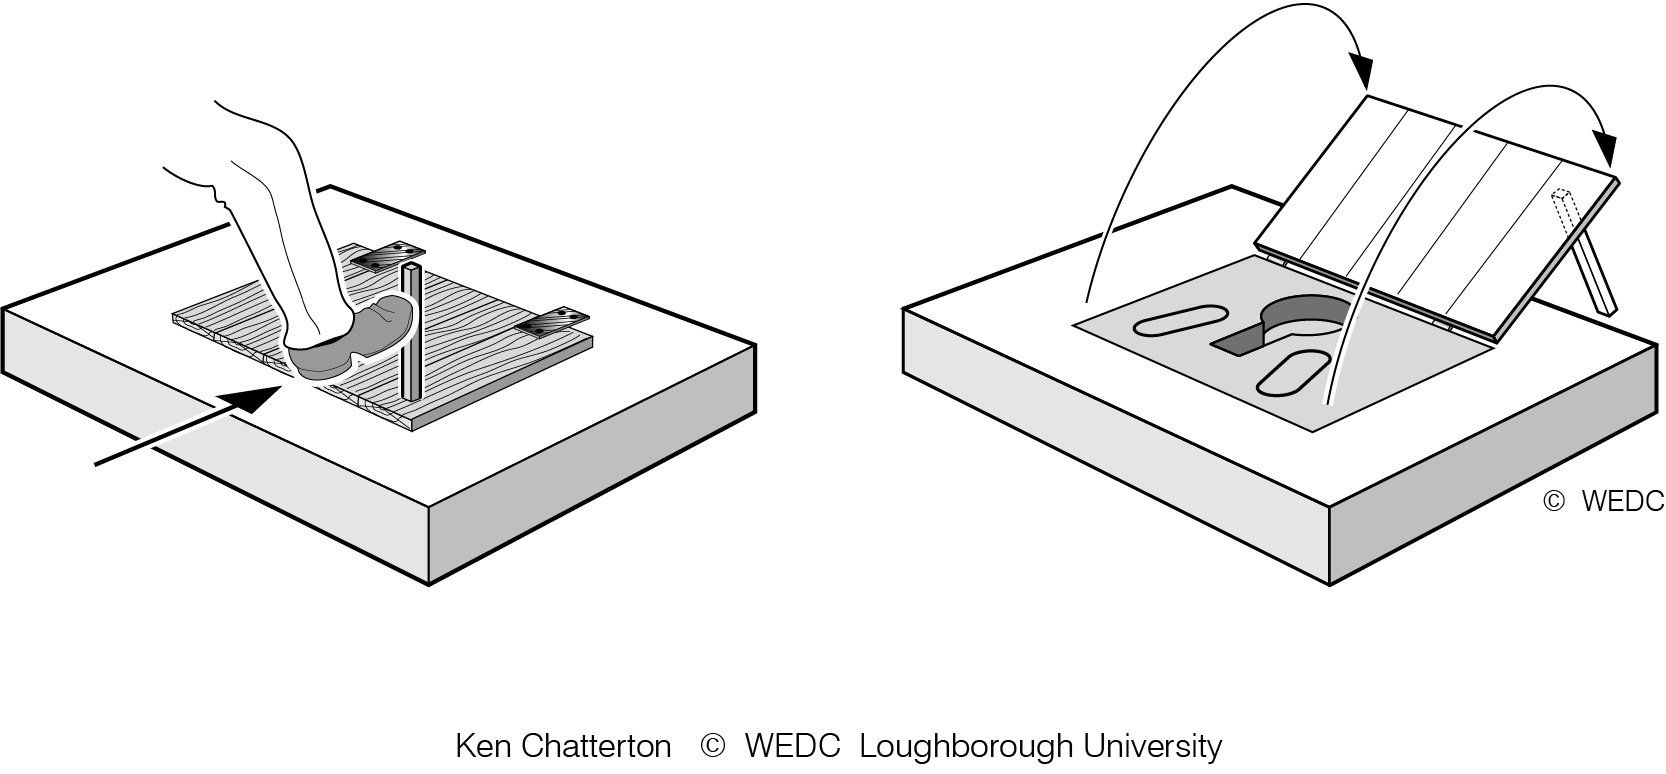
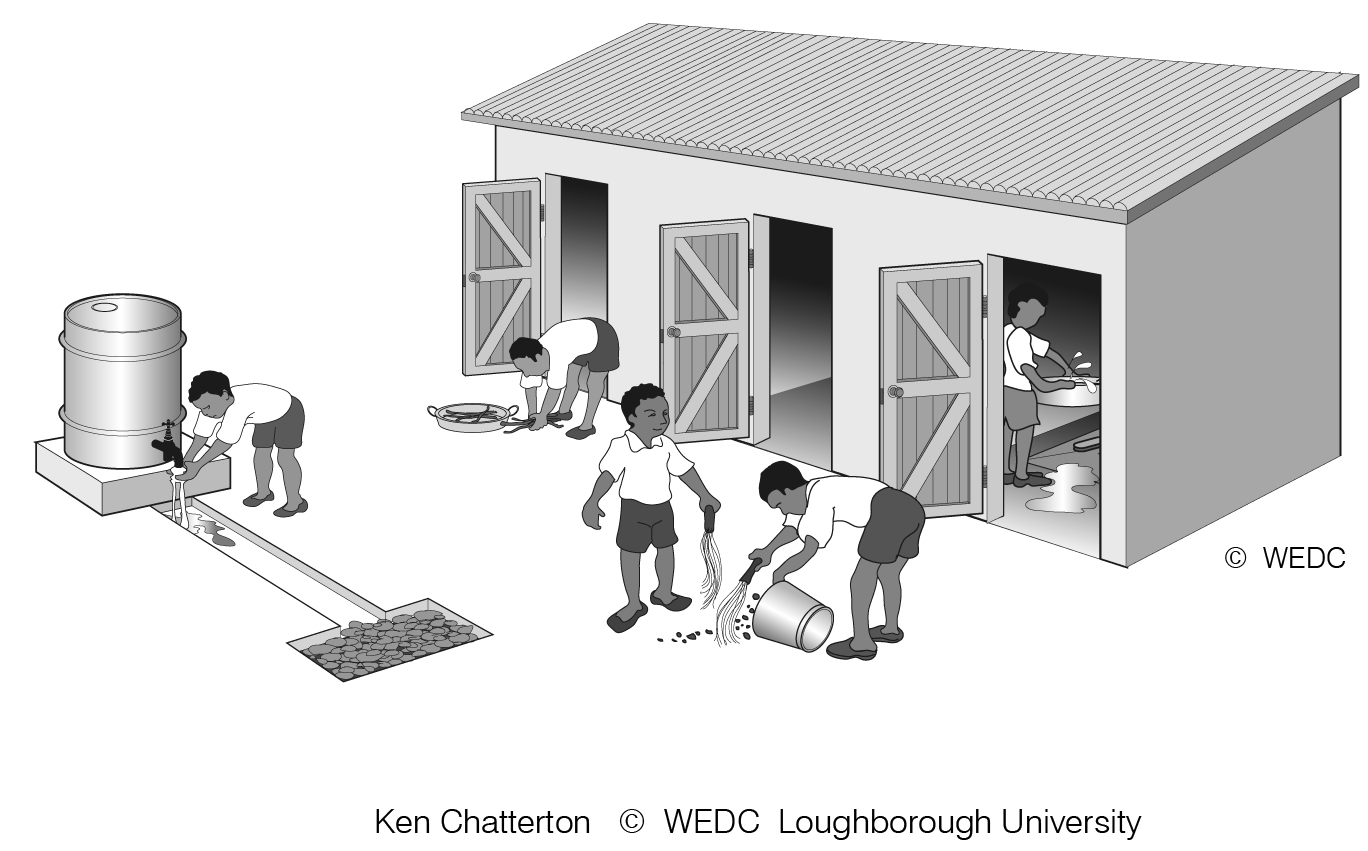
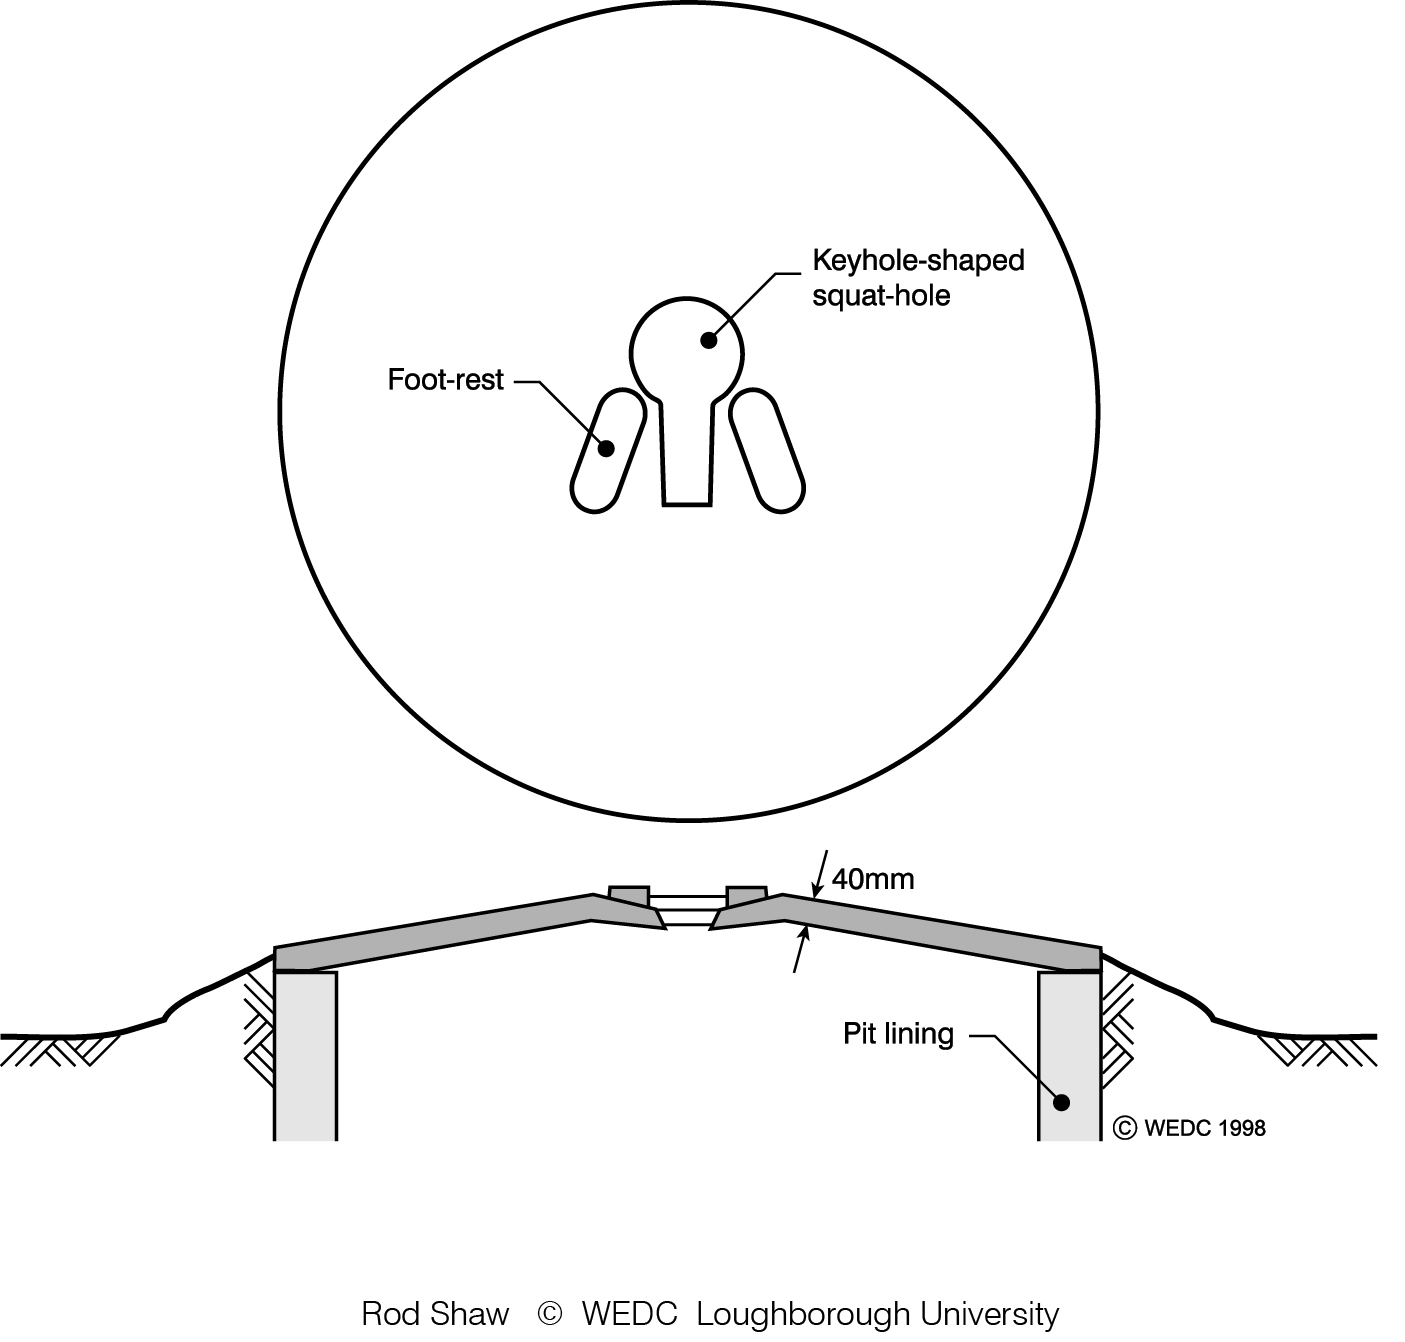
Squat-hole cover - revised foot position | Trickle feed tank | Who cleans the latrine | ||
|
|
| ||
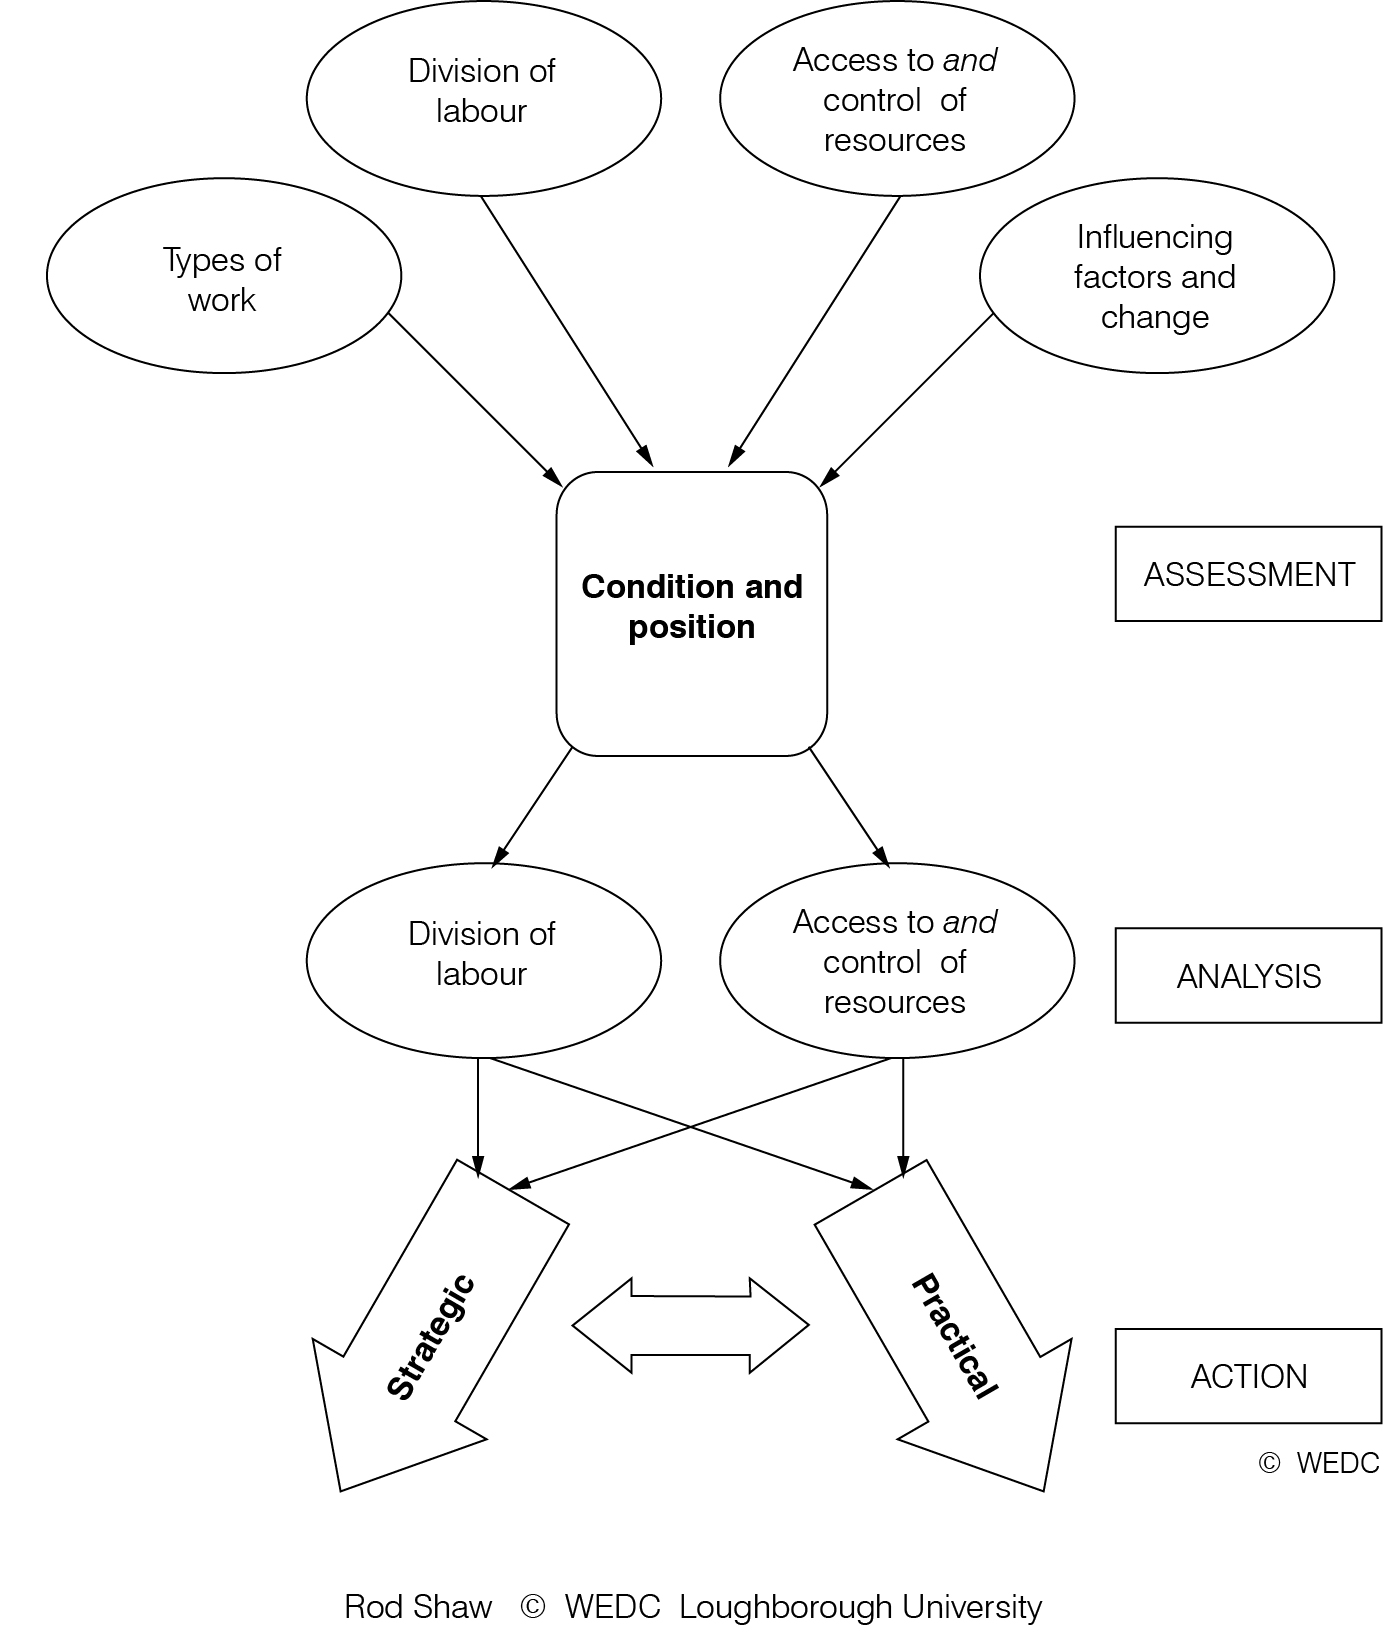
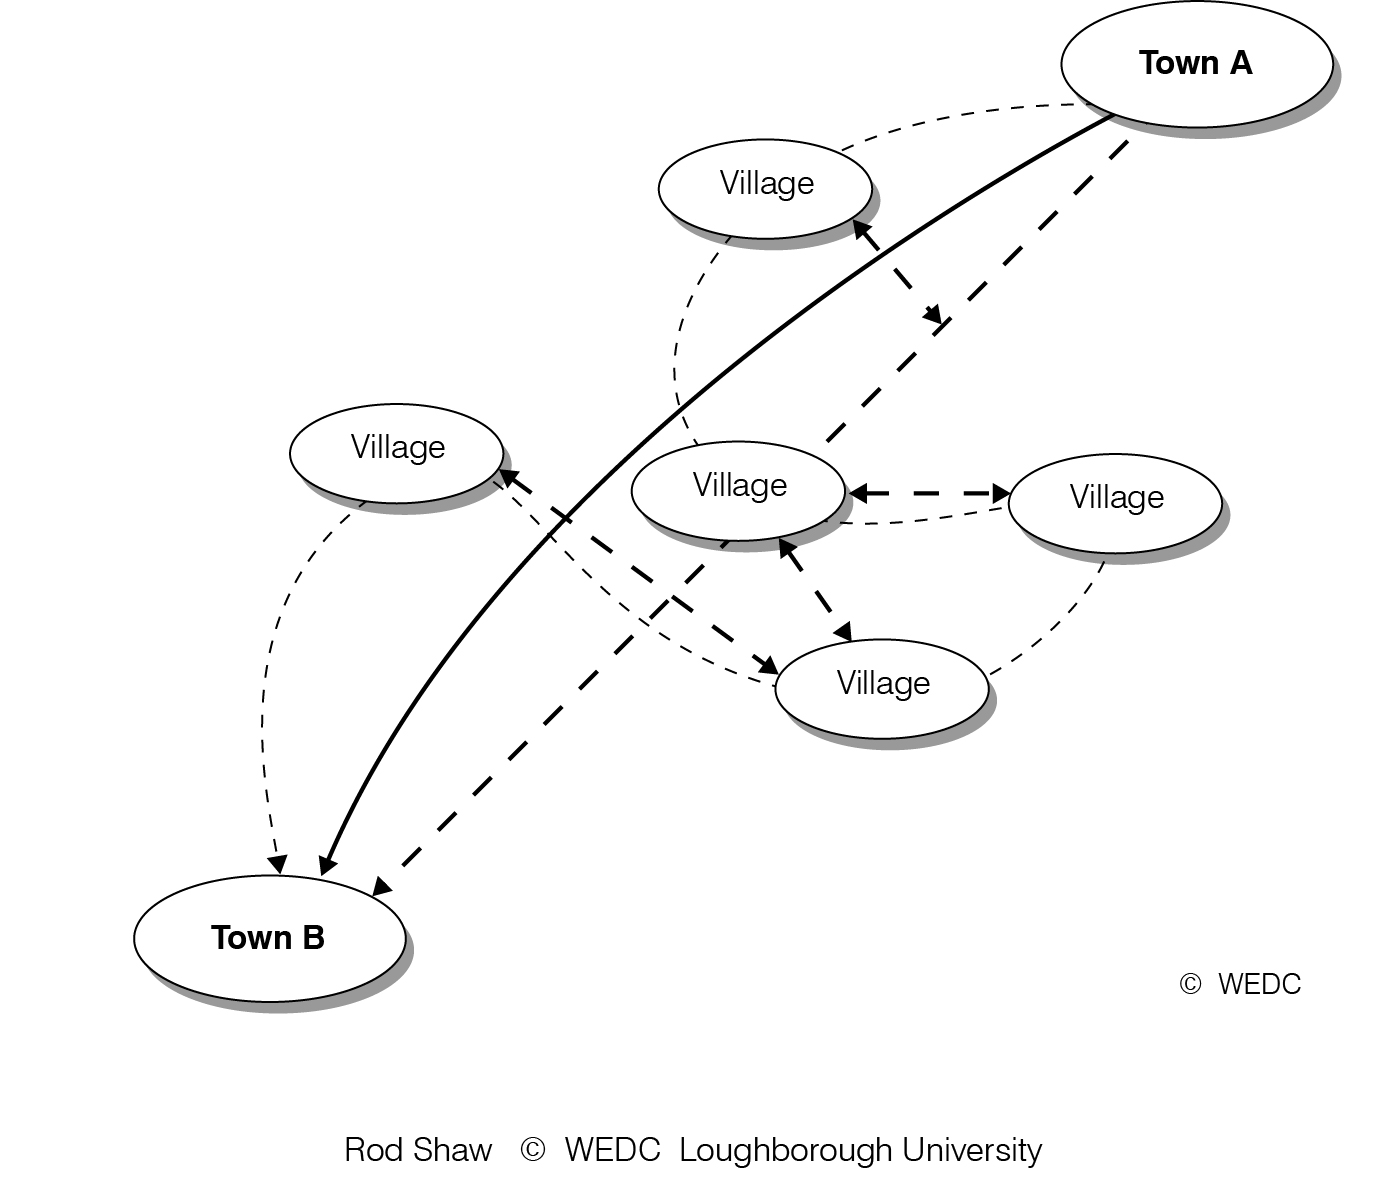
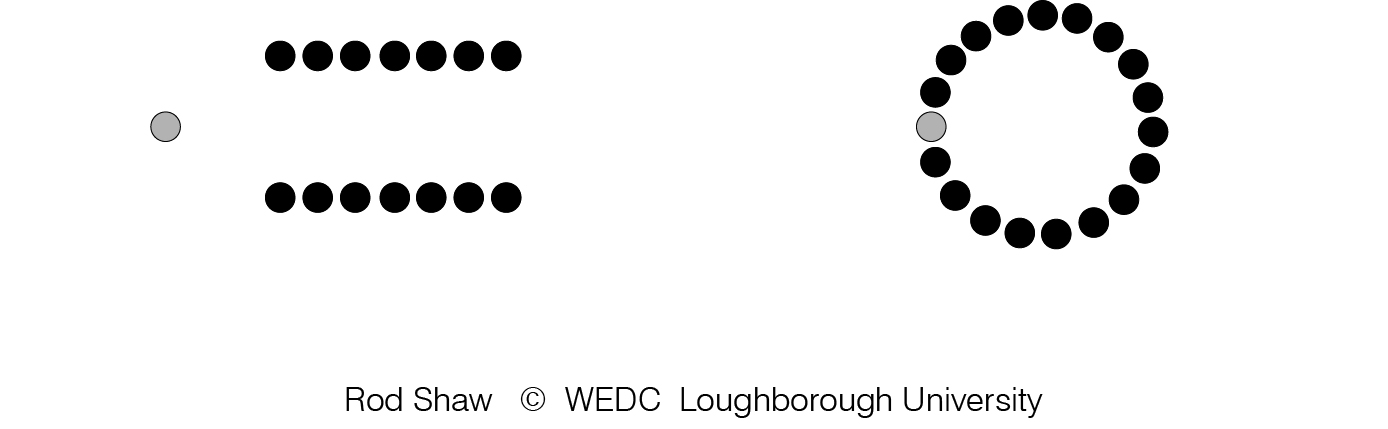
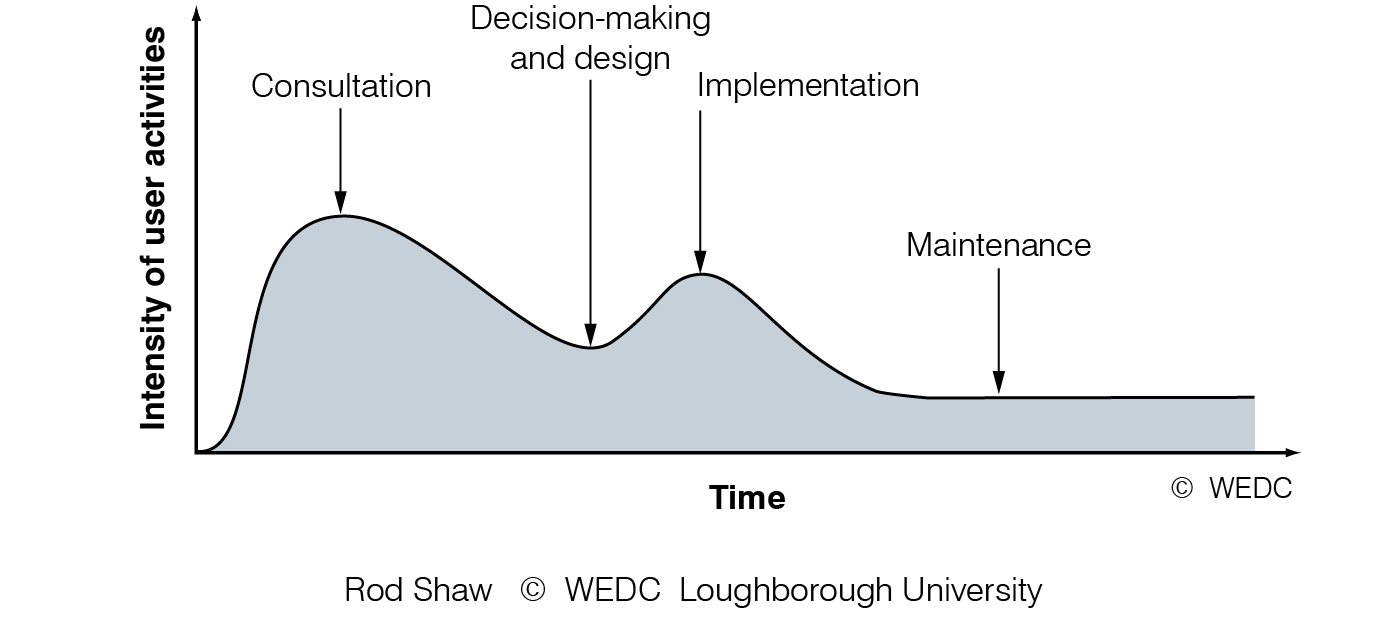
Activity profile | Assessment analysis action | Best route A to B | ||

|

|
| ||
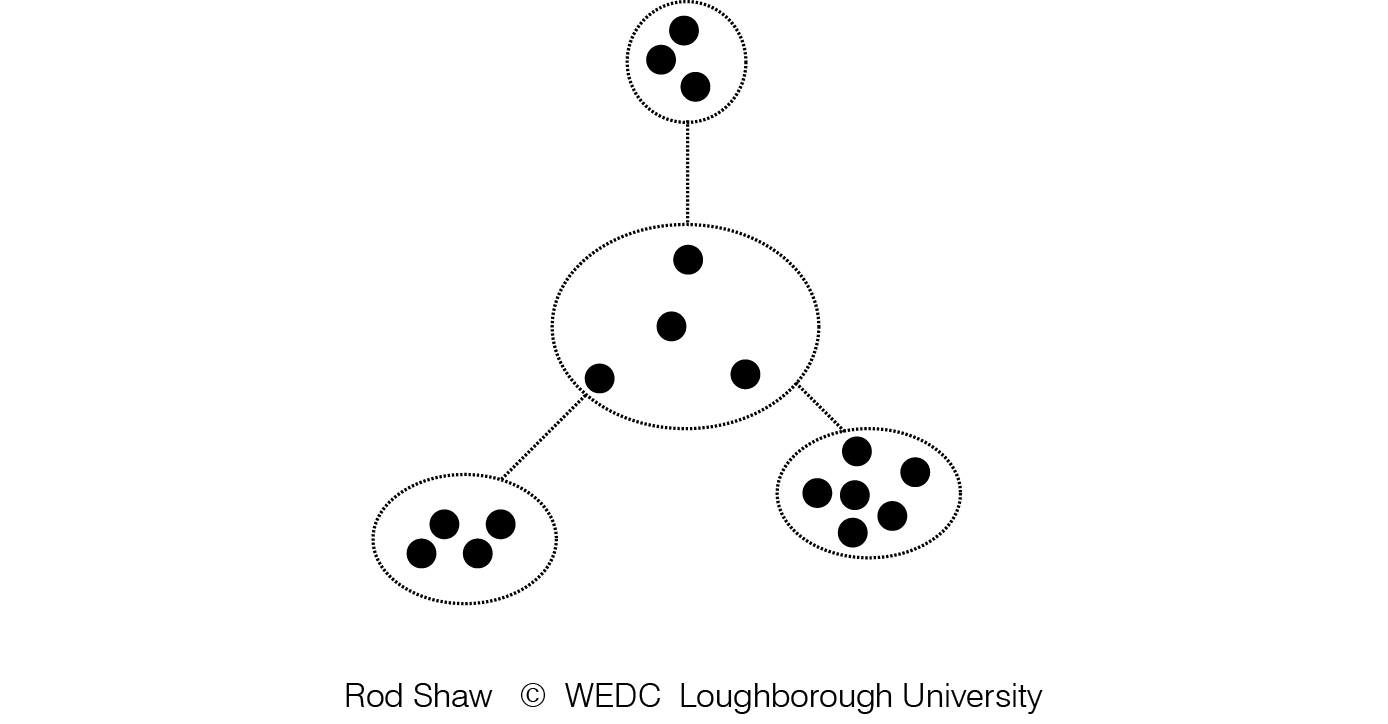
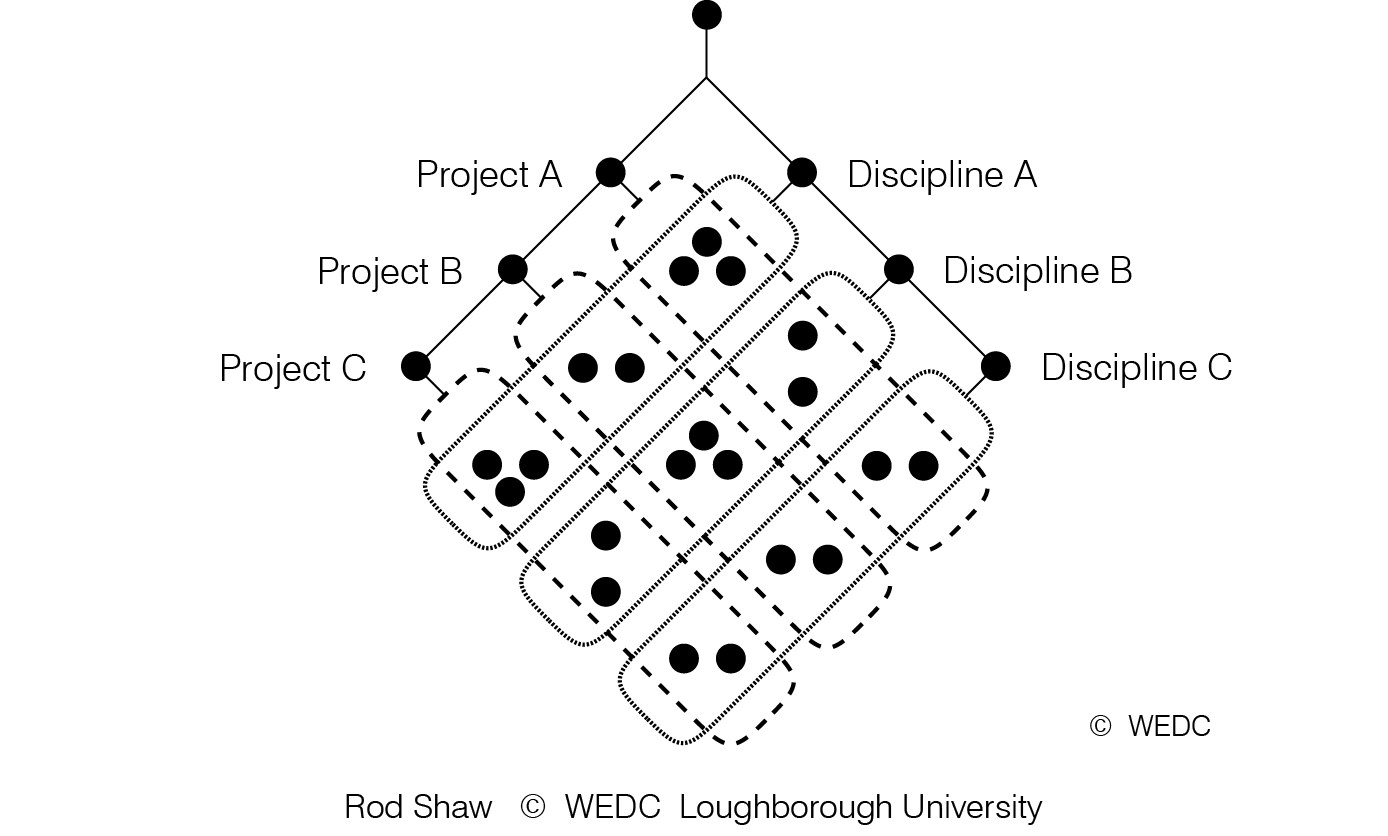
Bivariate and multiple regressions | Bivariate comparisons between various factors and project effectiveness | Clustered management | ||

|

|

| ||
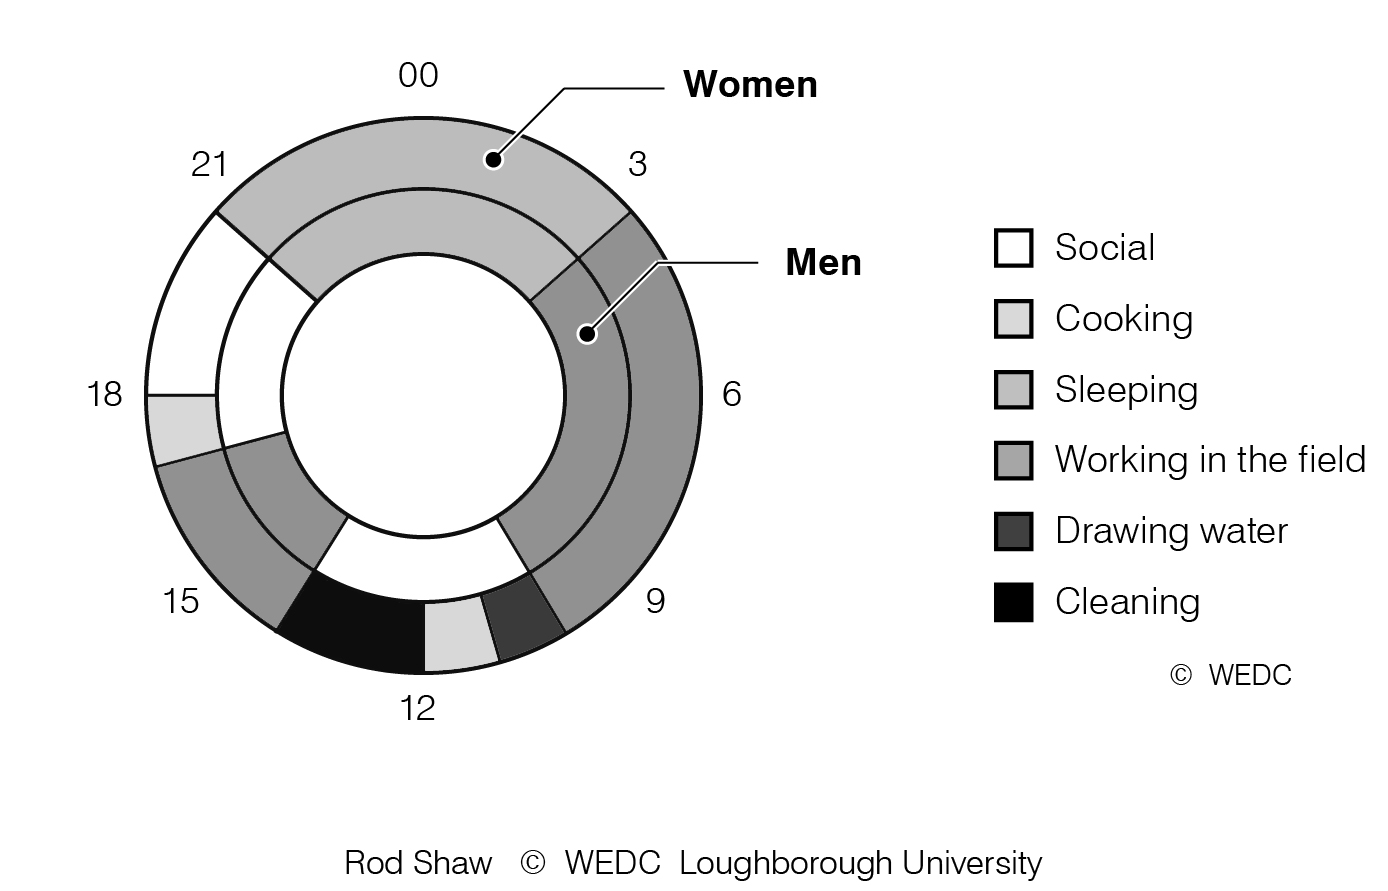
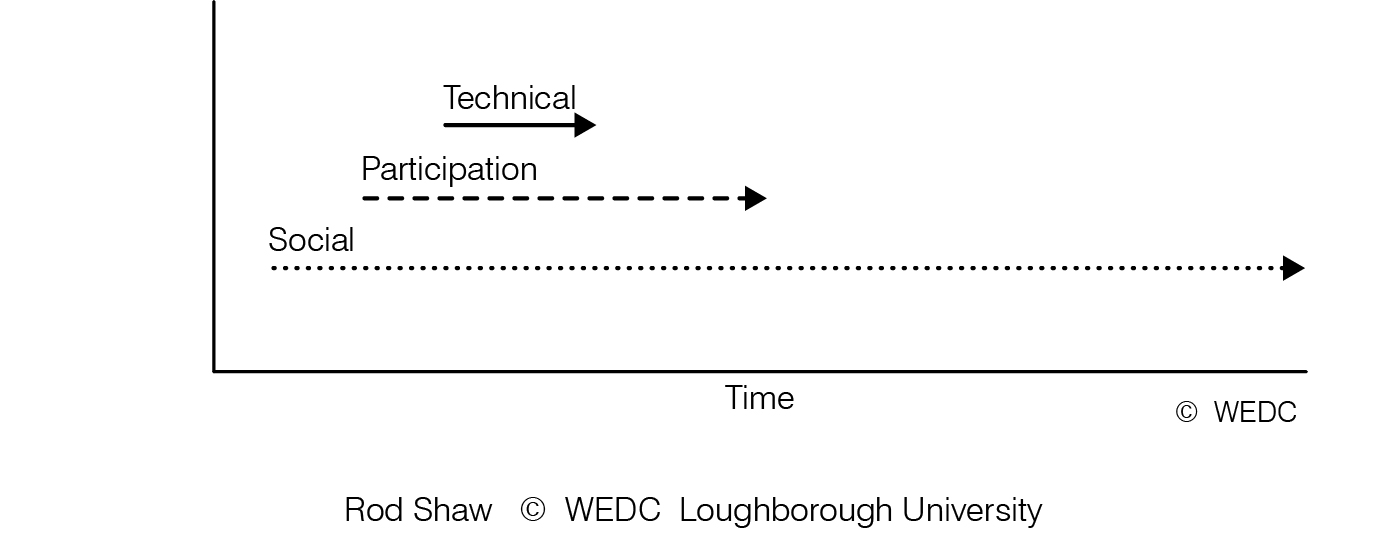
Continuum of attitudes towards change | Cost of change against project stage | Daily hours of labour | ||
|
|
| ||
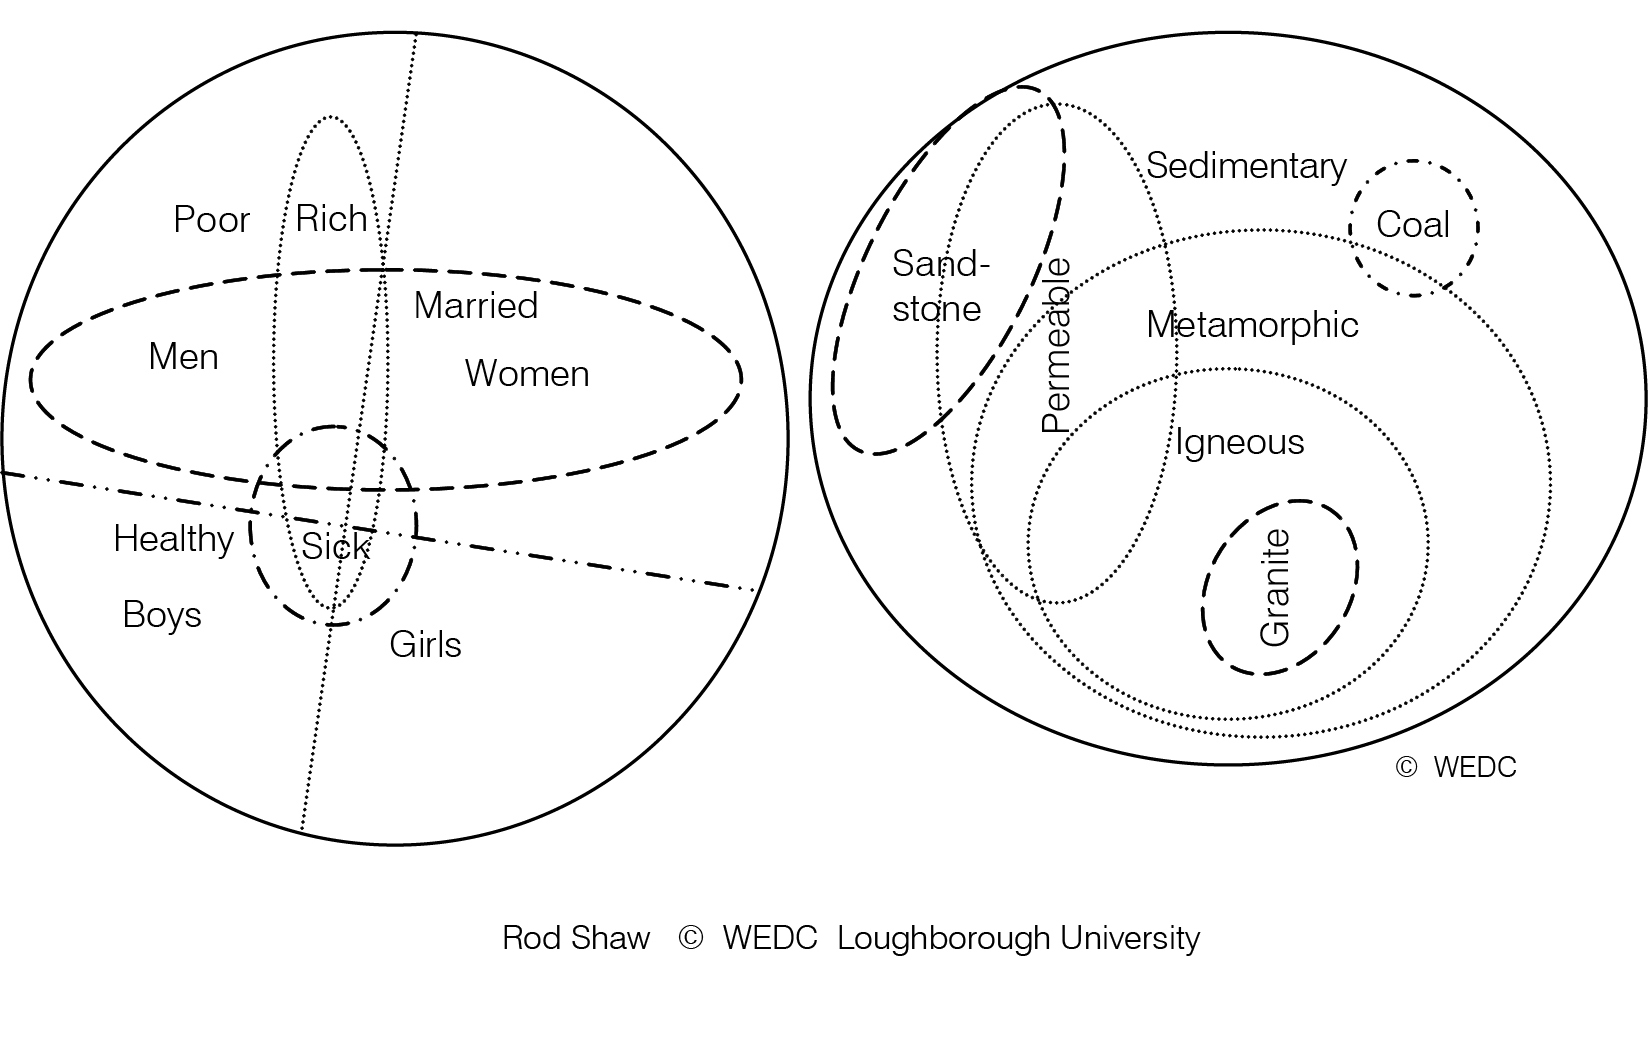
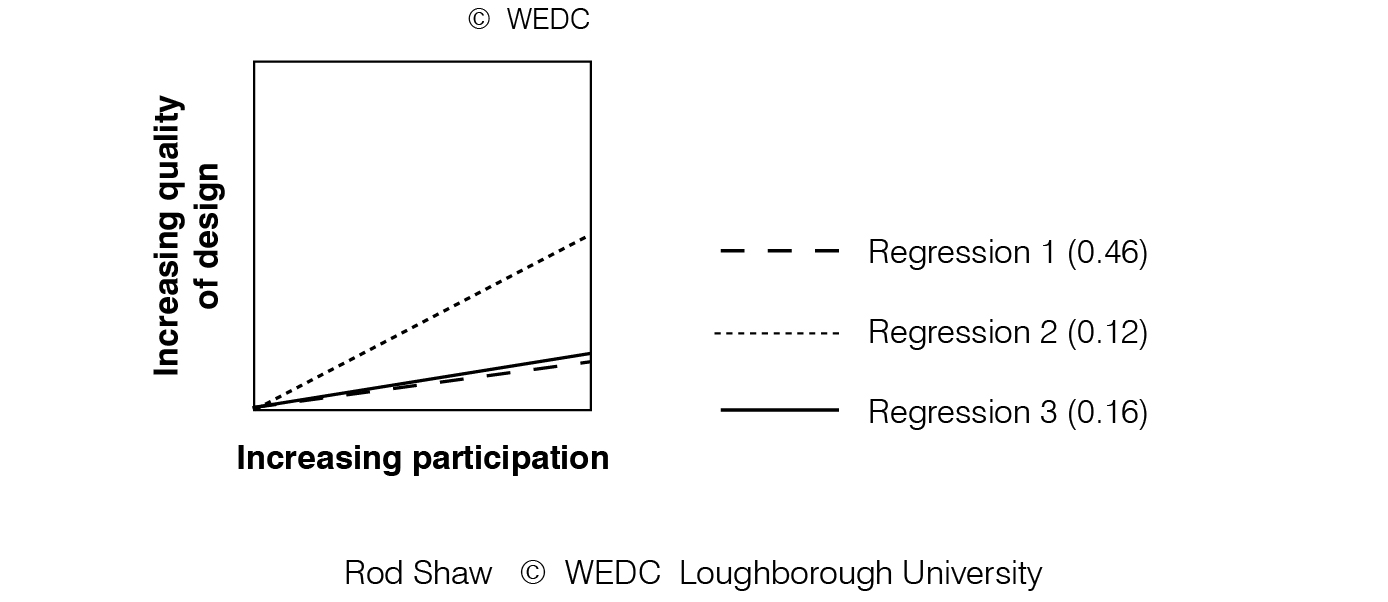
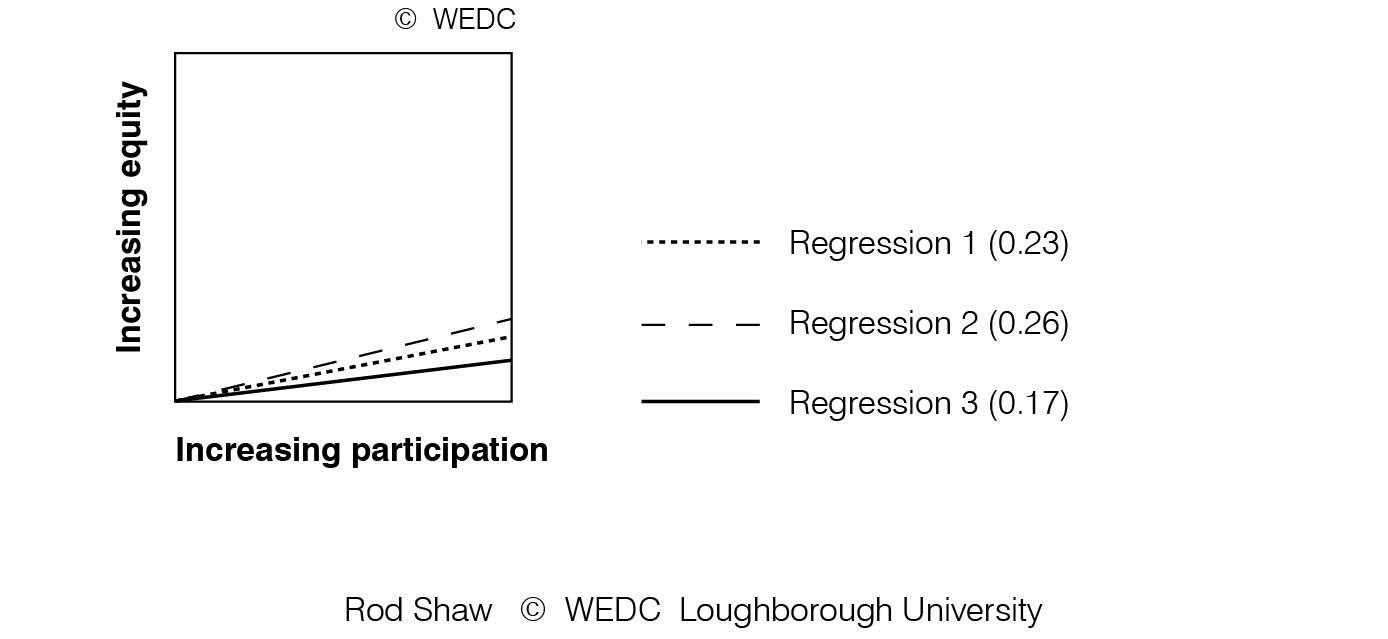
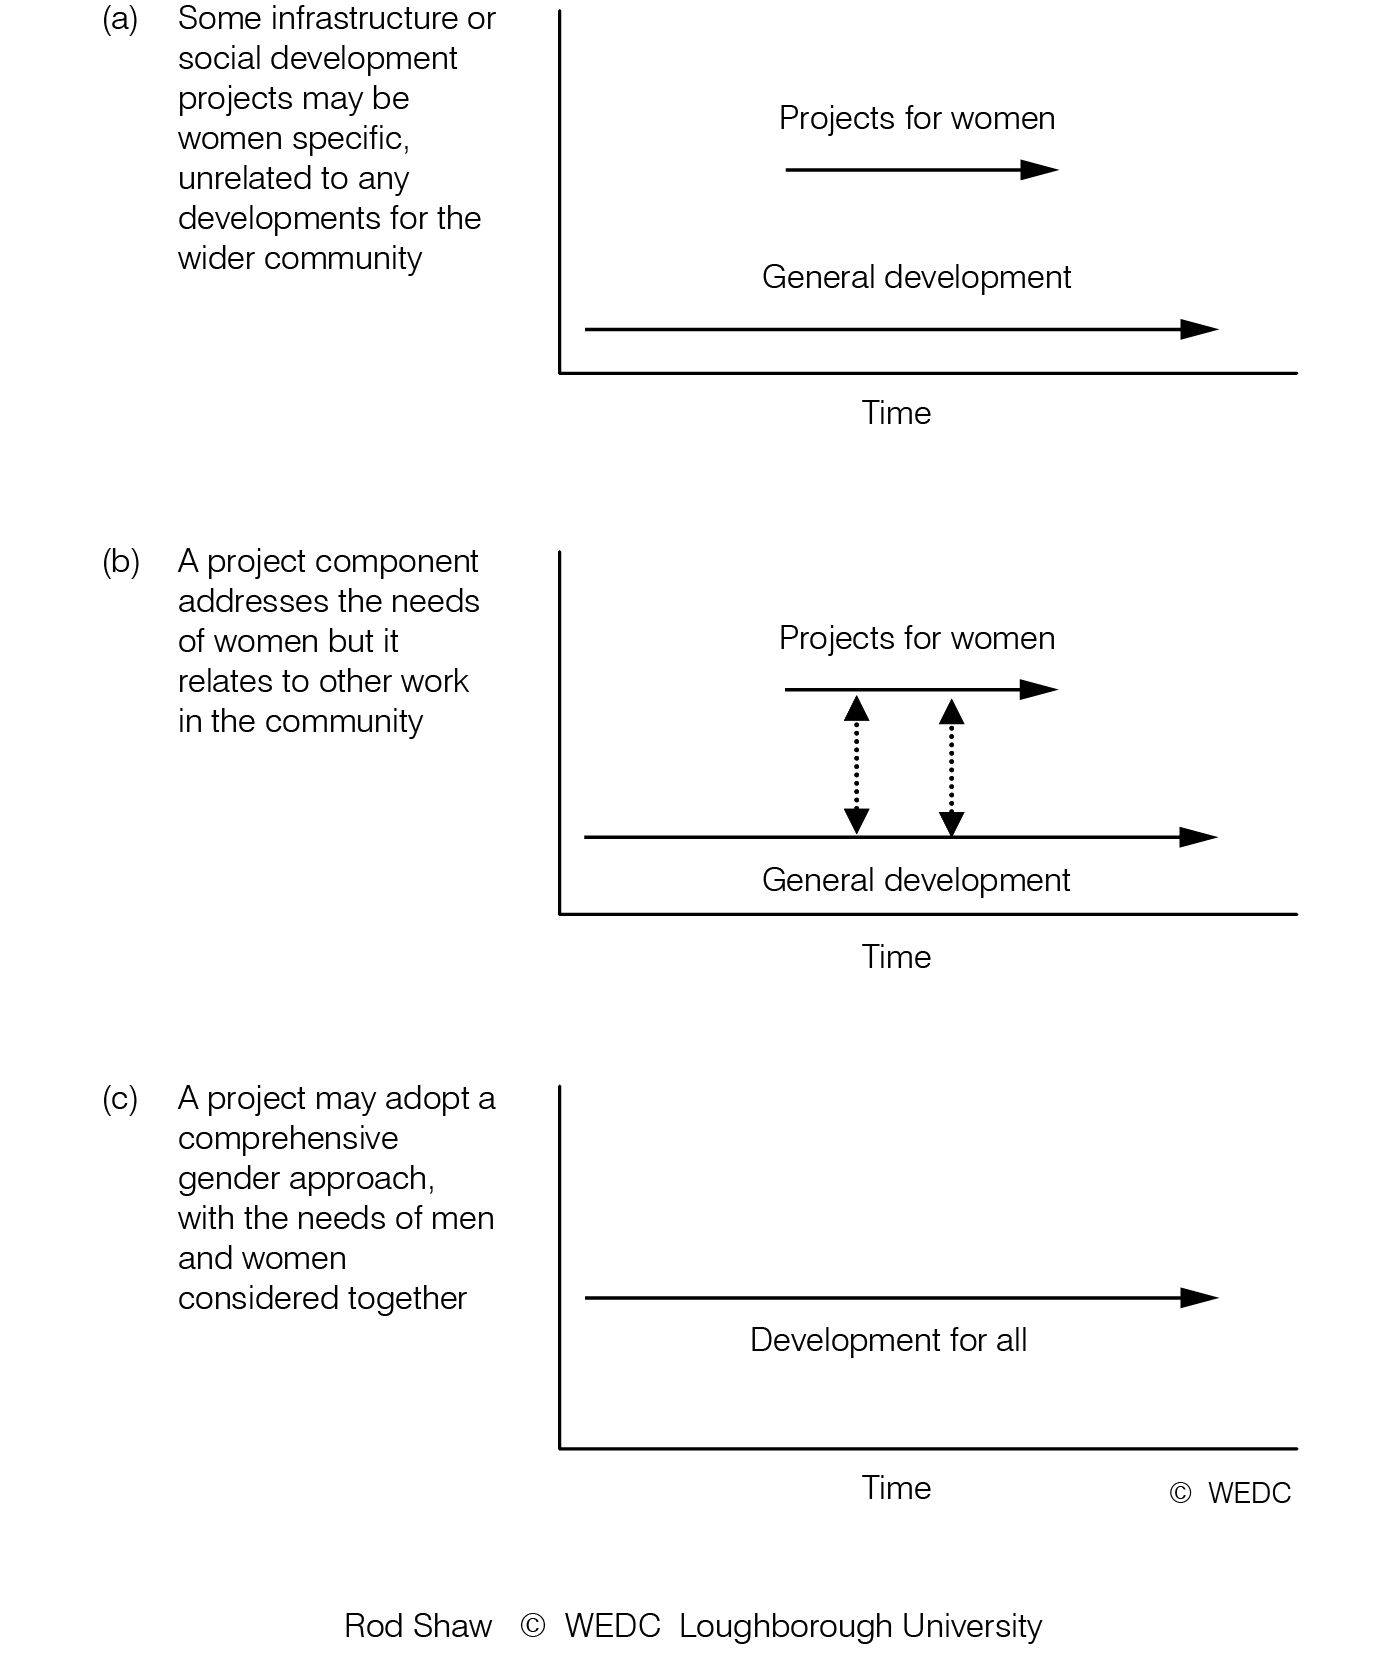
Developing a classification structure | Does increasing participation improve design | Does increasing participation improve equity | ||
|

|
| ||
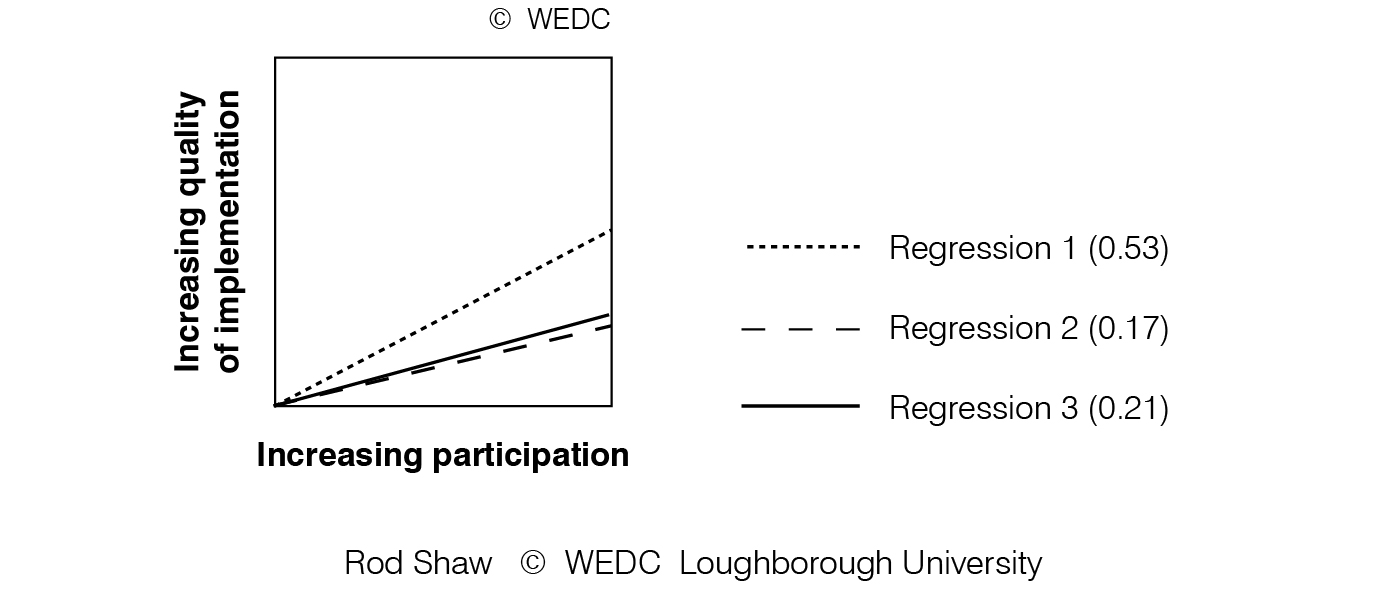
Does increasing participation improve implementation | Does increasing participation improve physical outputs | Domed pit slab - plan and cross-section | ||
|
|
| ||
Leading from the front or first amongst equals | Length and cost of project stages | Malawi gravity flow schemes | ||
|

|
| ||
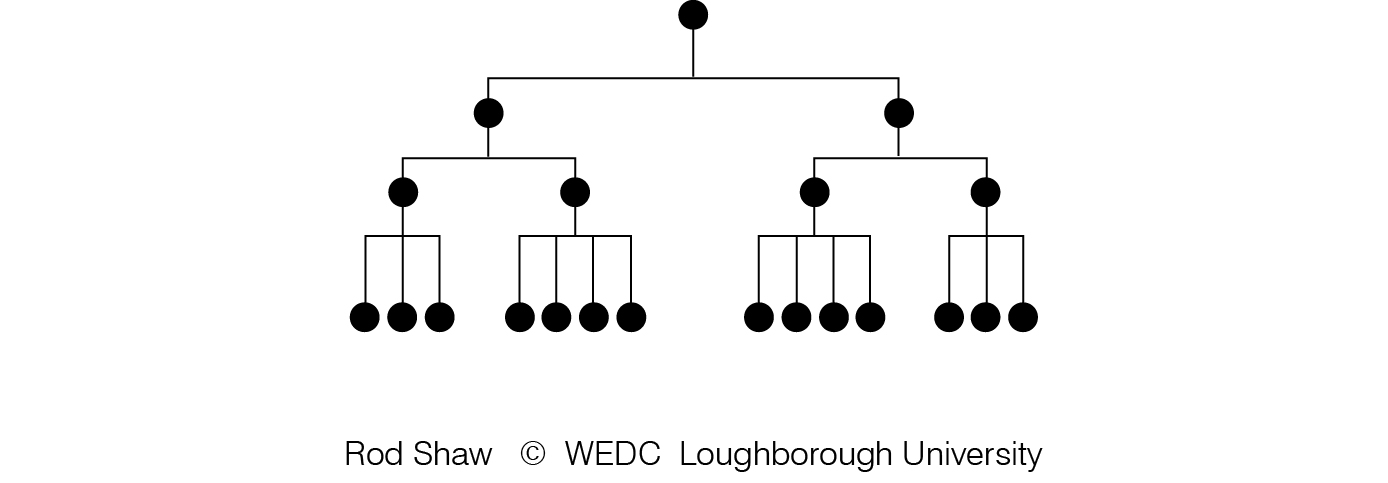
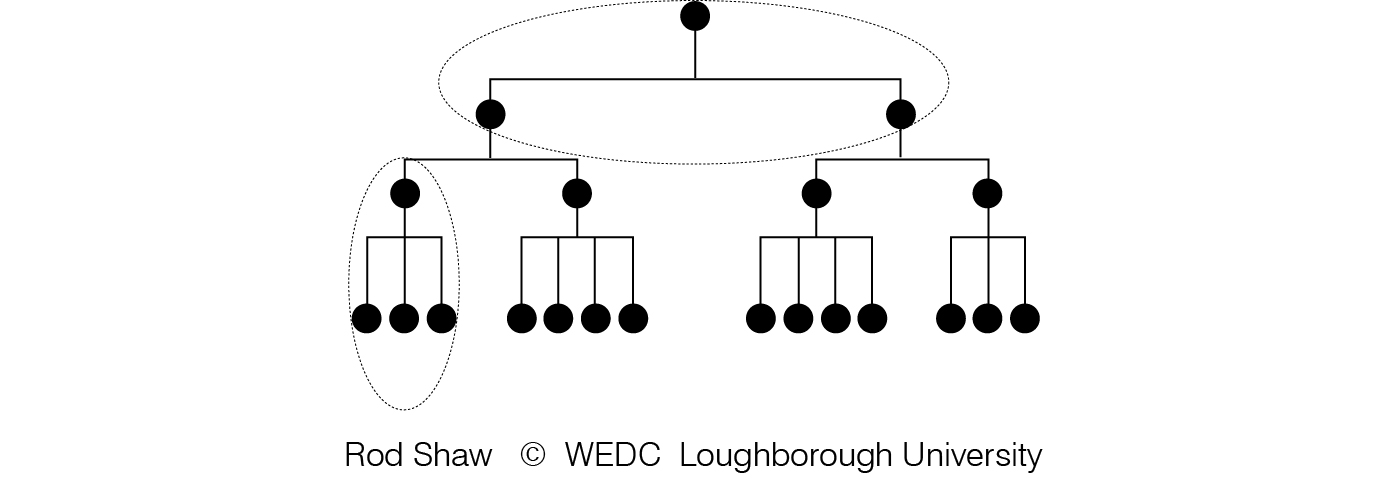
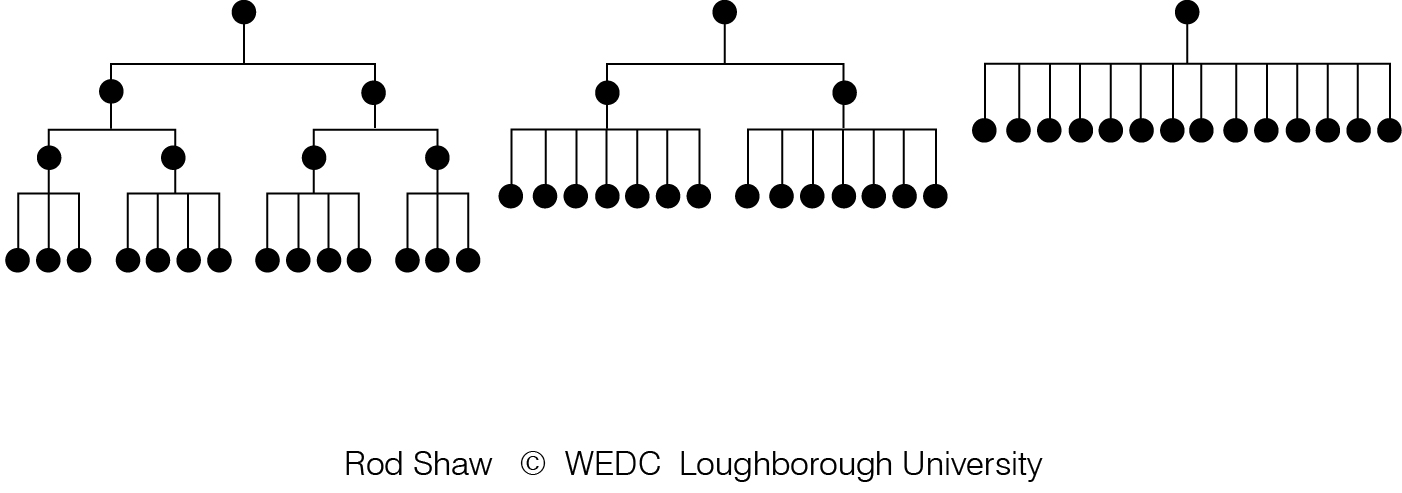
Matrix management | Numbers of participants | Organisation chart of a workforce | ||
|
|
| ||
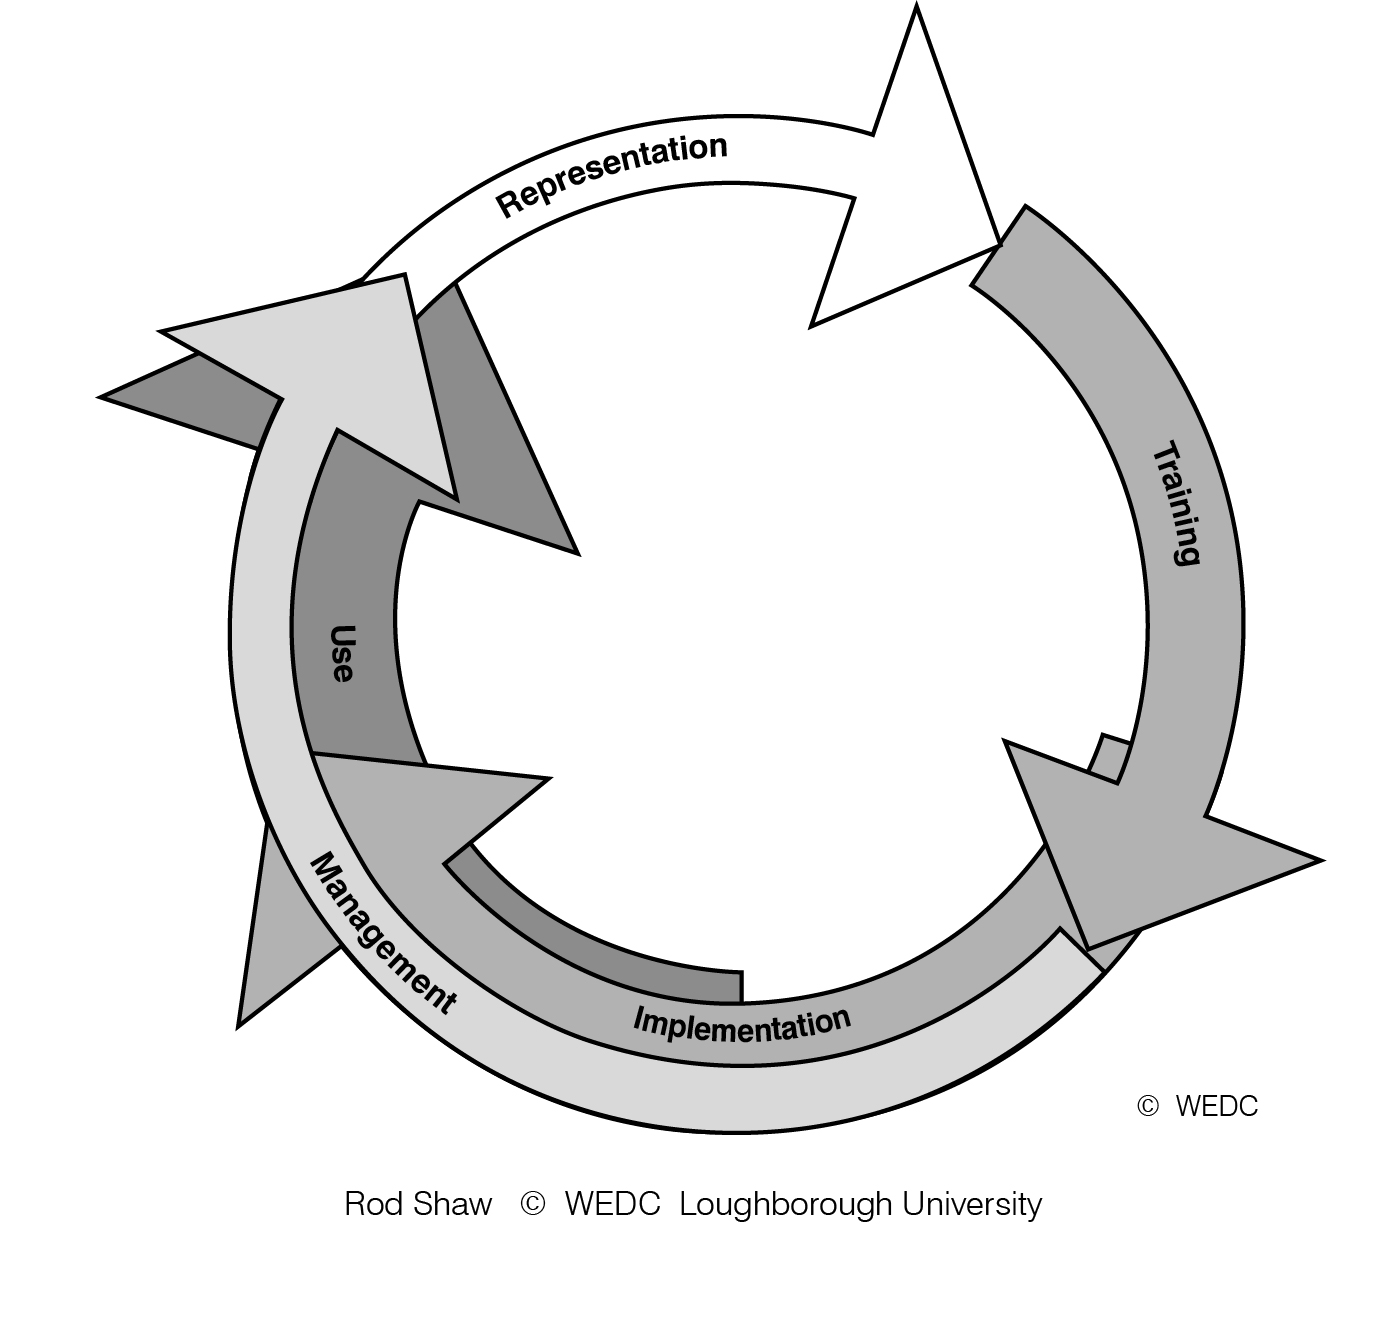
Participation builds communities | Participation equals effectiveness | Participation in the project cycle | ||
|
|
| ||
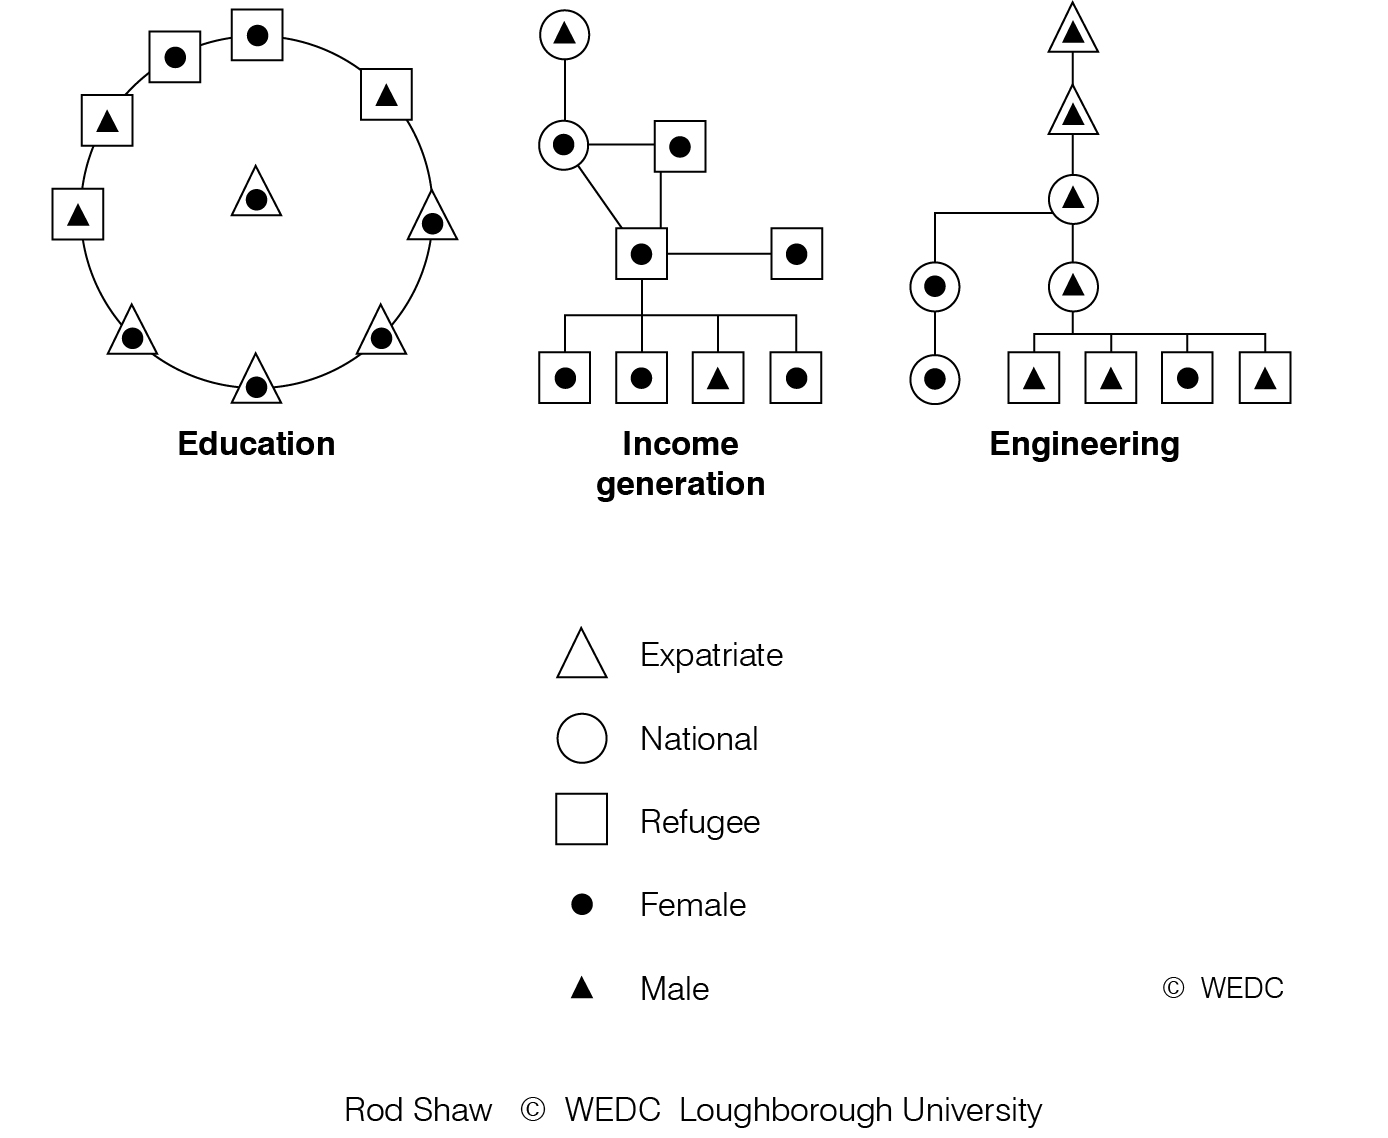
Participation of organisational structure | Patterns of participation | Perceptions of organisational structure 1 | ||
|
|

| ||
Perceptions of organisational structure 2 | Projects targeting specific groups | Project control scenarios | ||
|
|
| ||
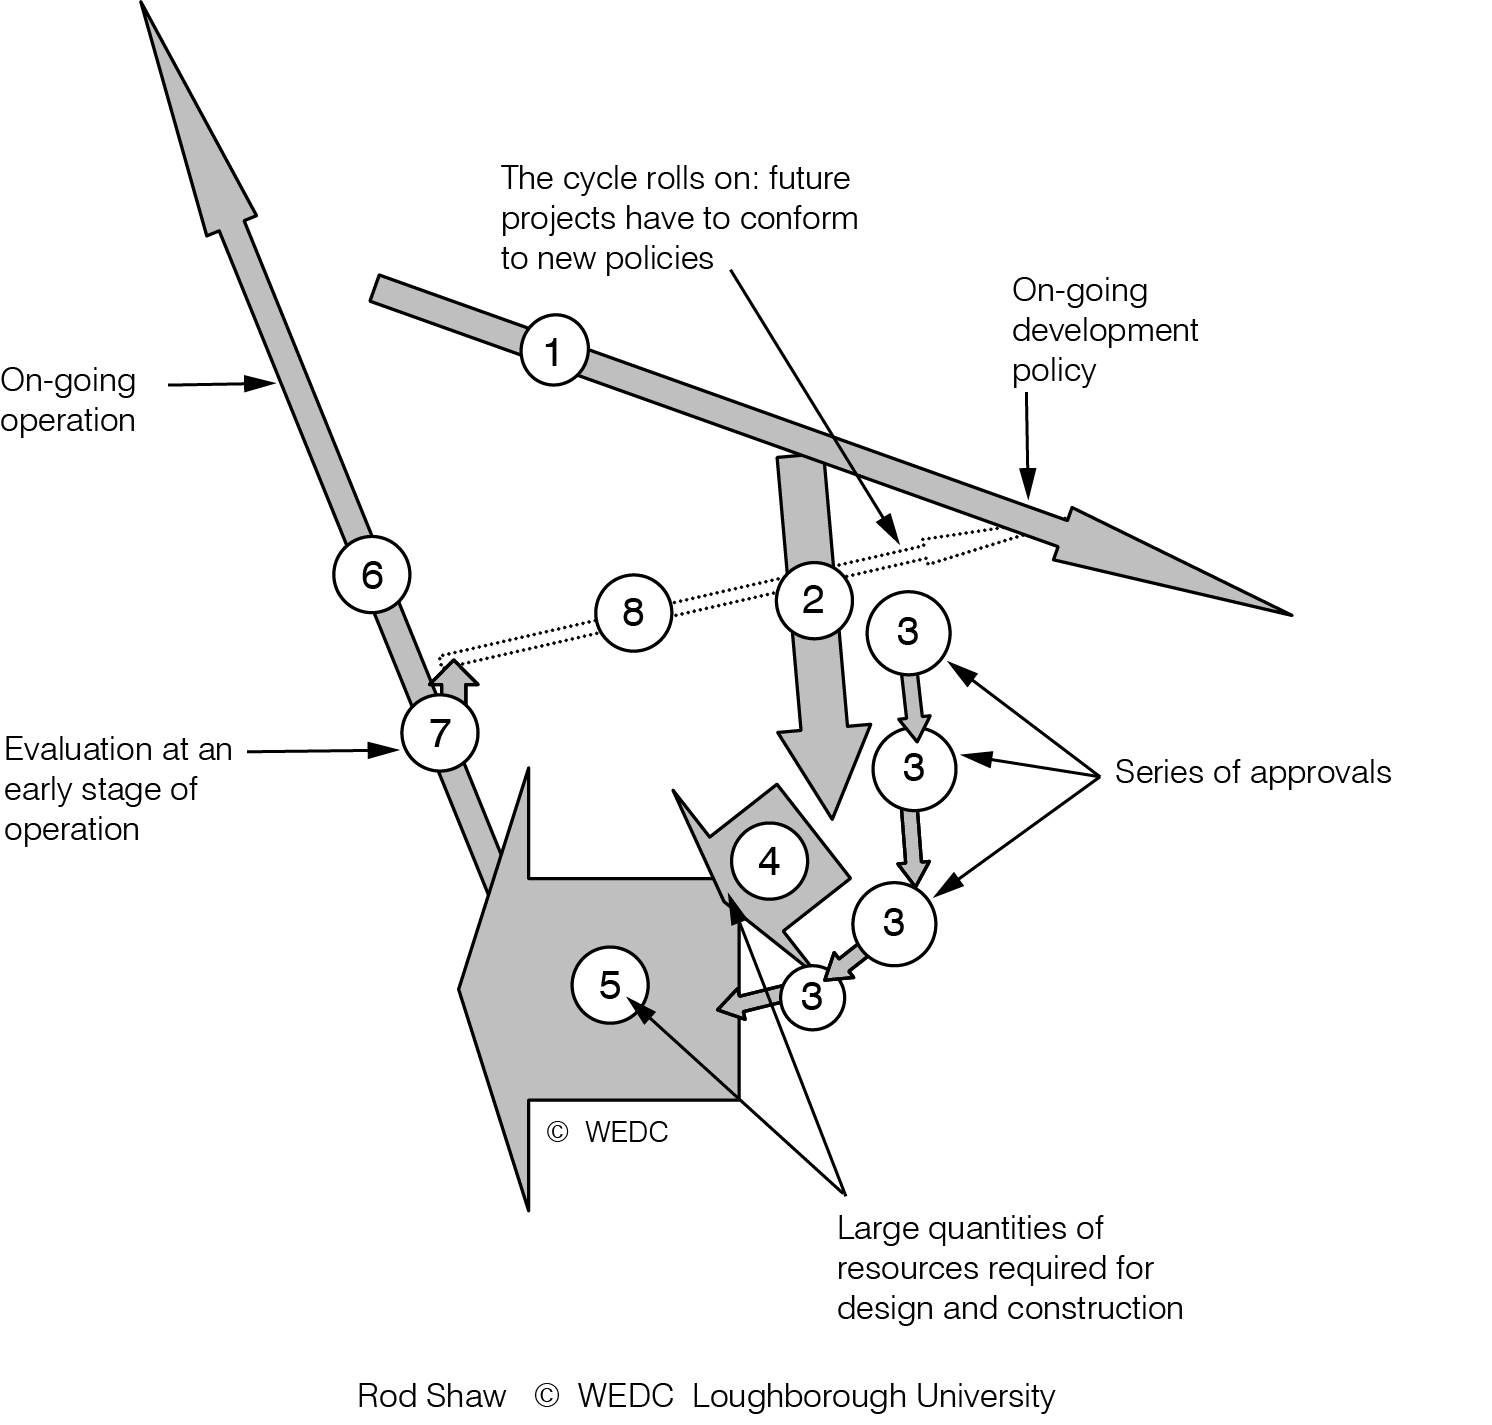
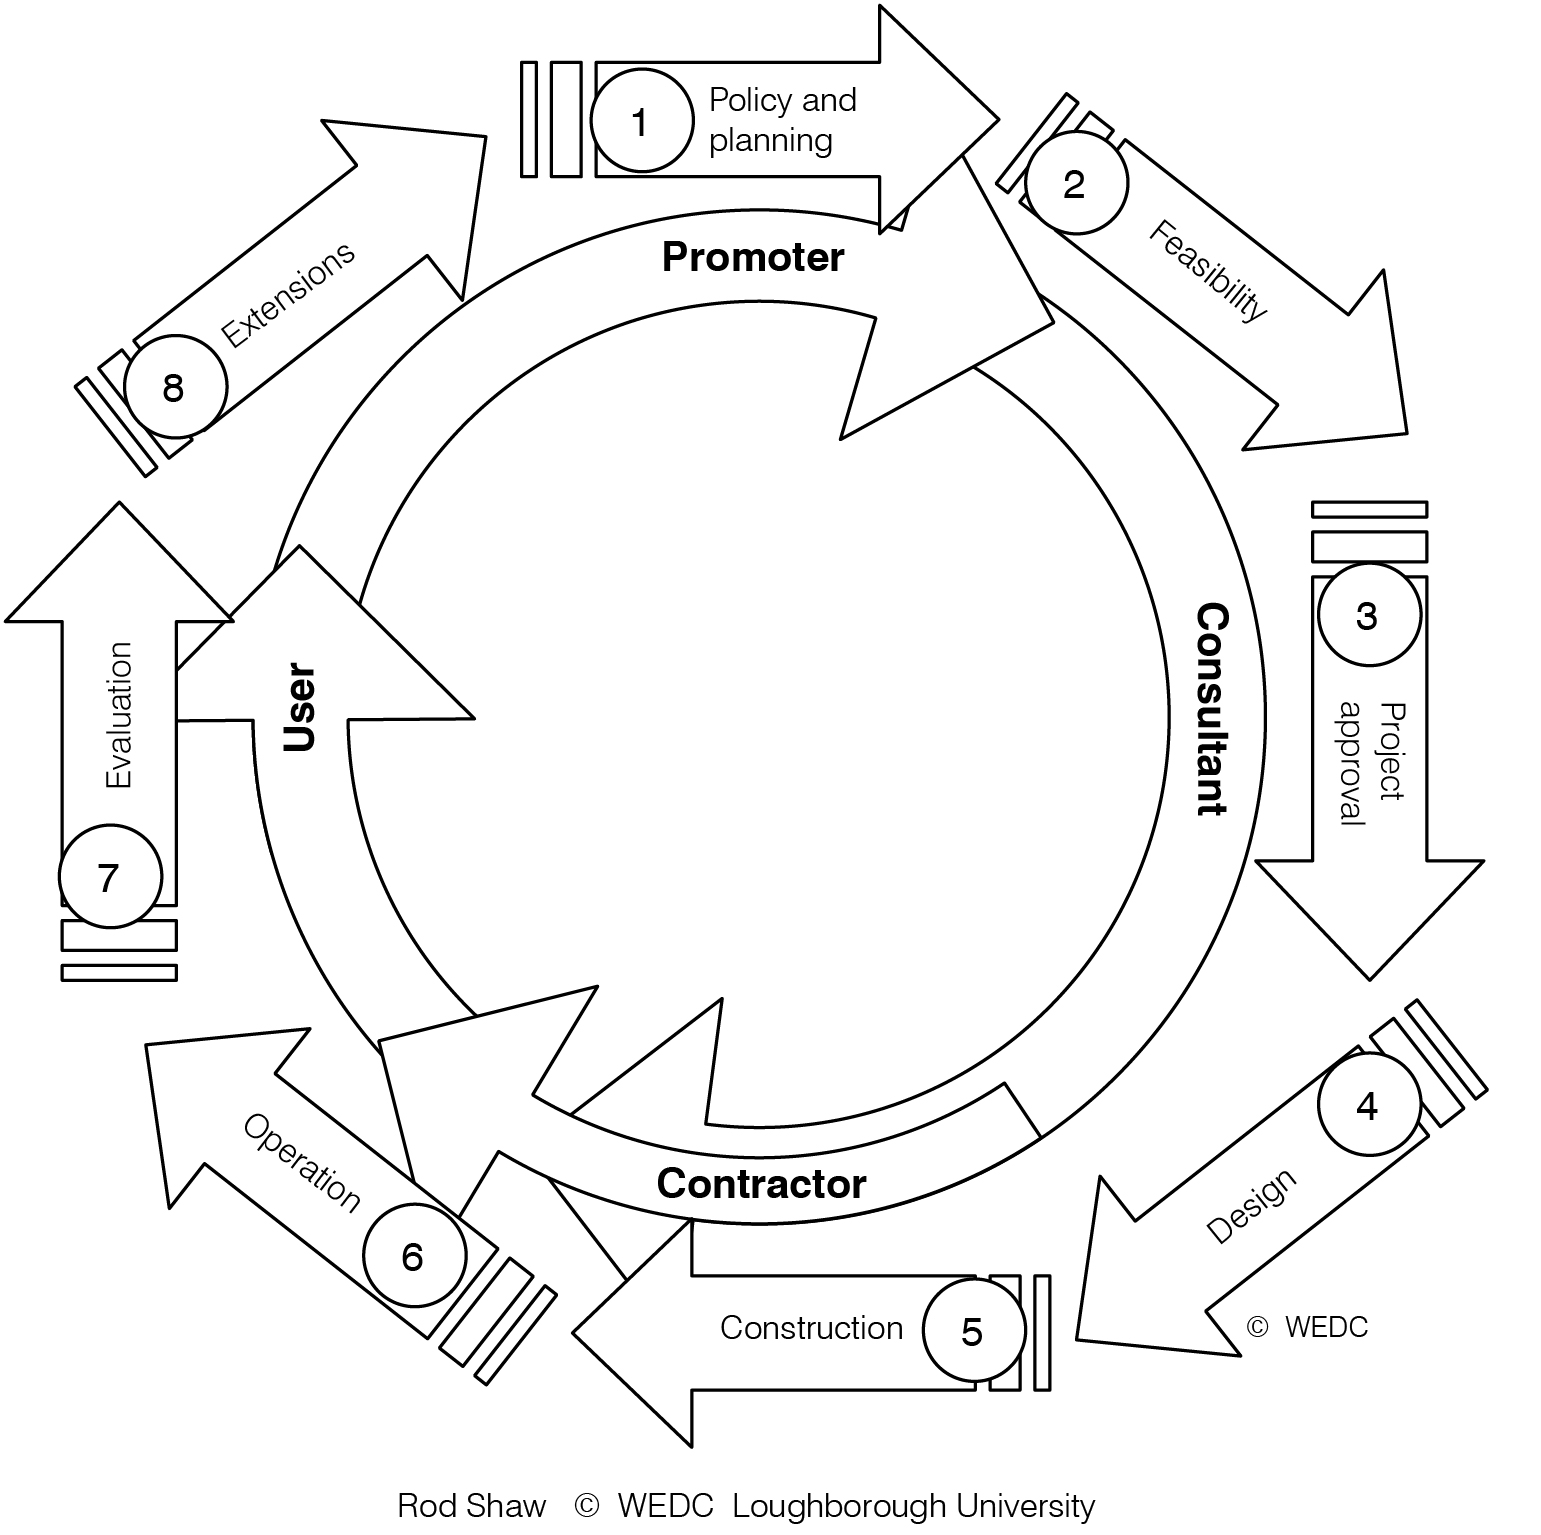
Project cycle and main participants | Project programme and resources | Project teams | ||
|
|
| ||
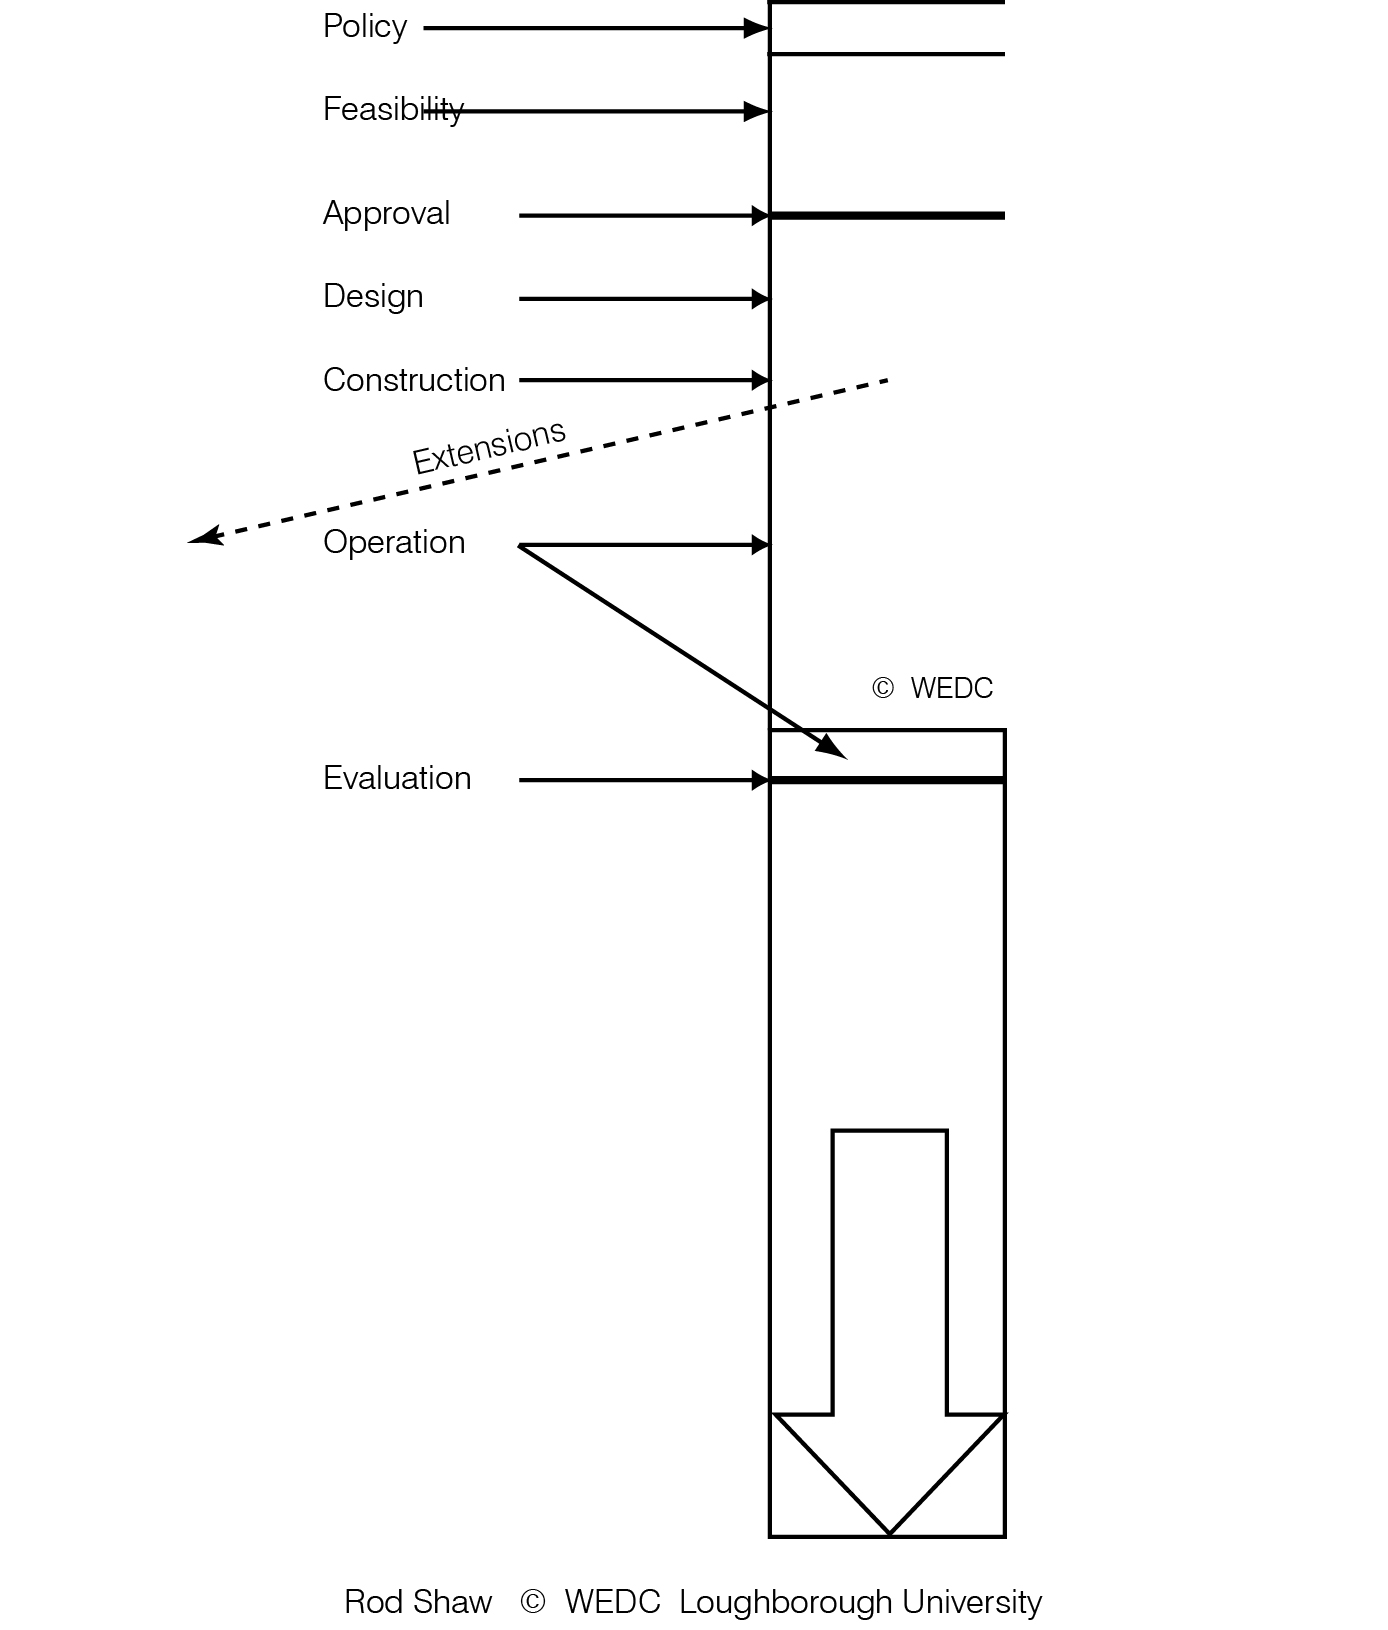
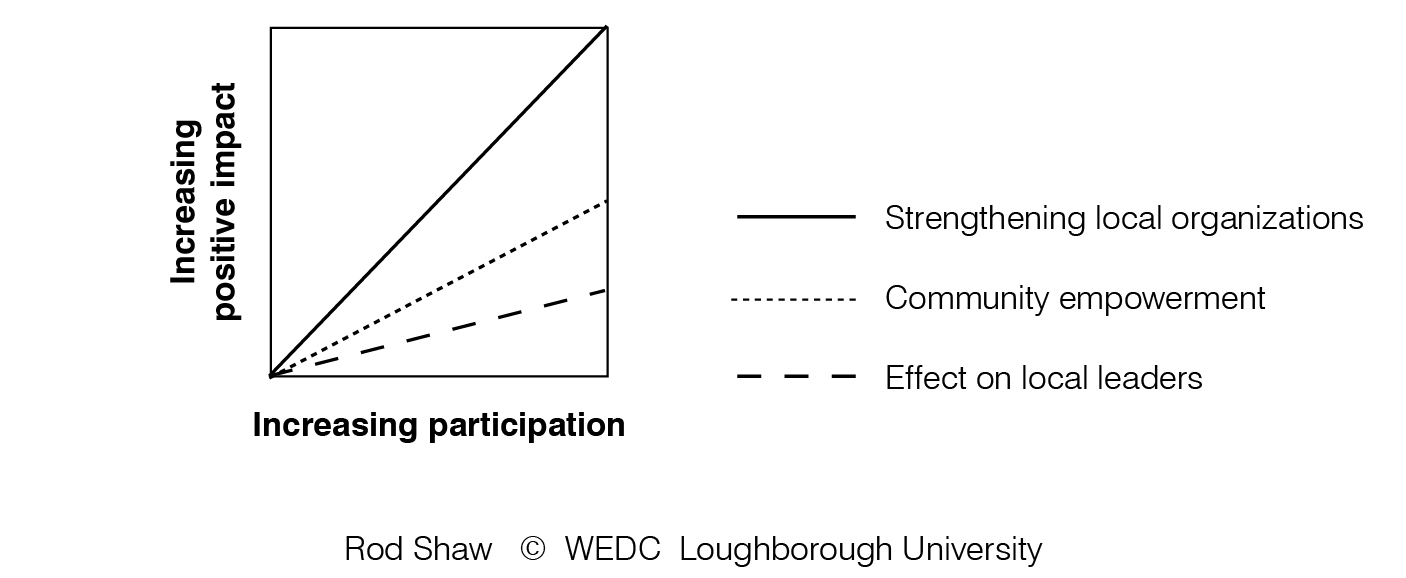
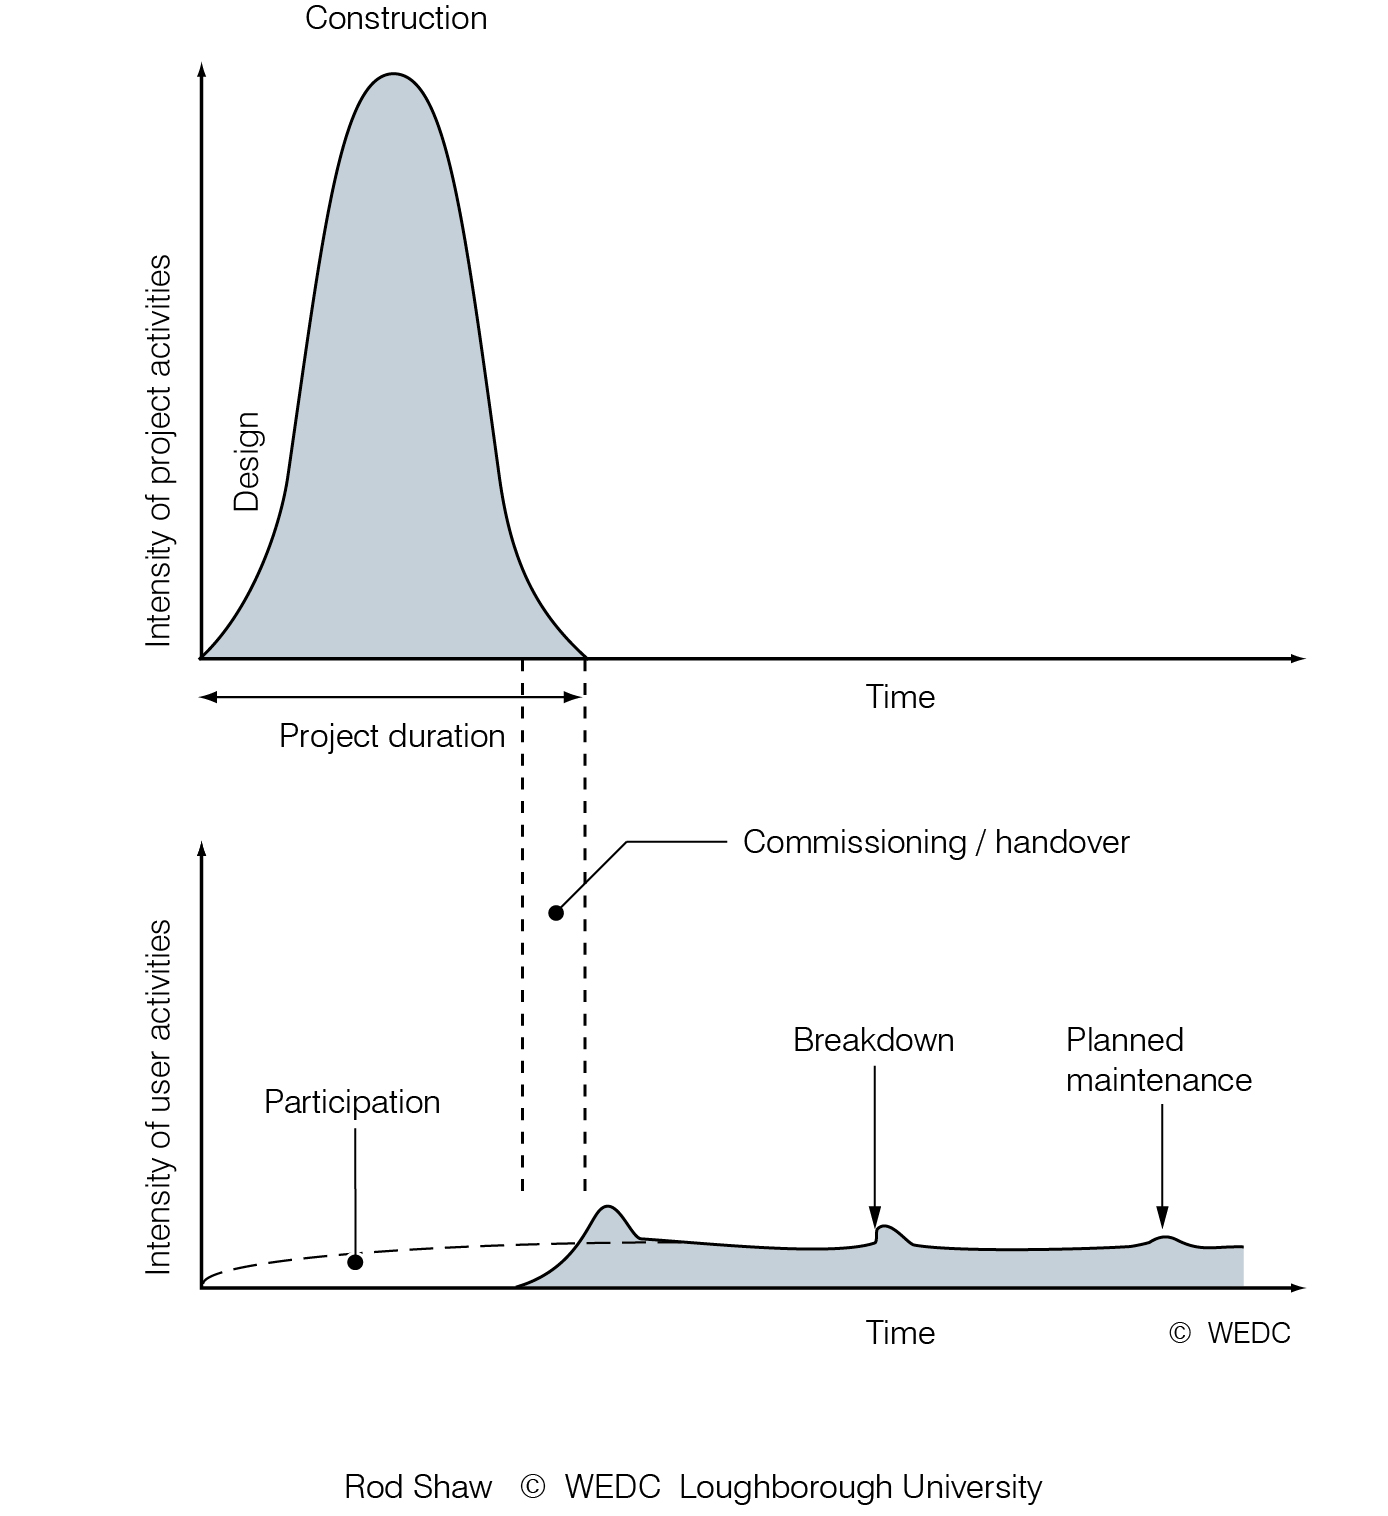
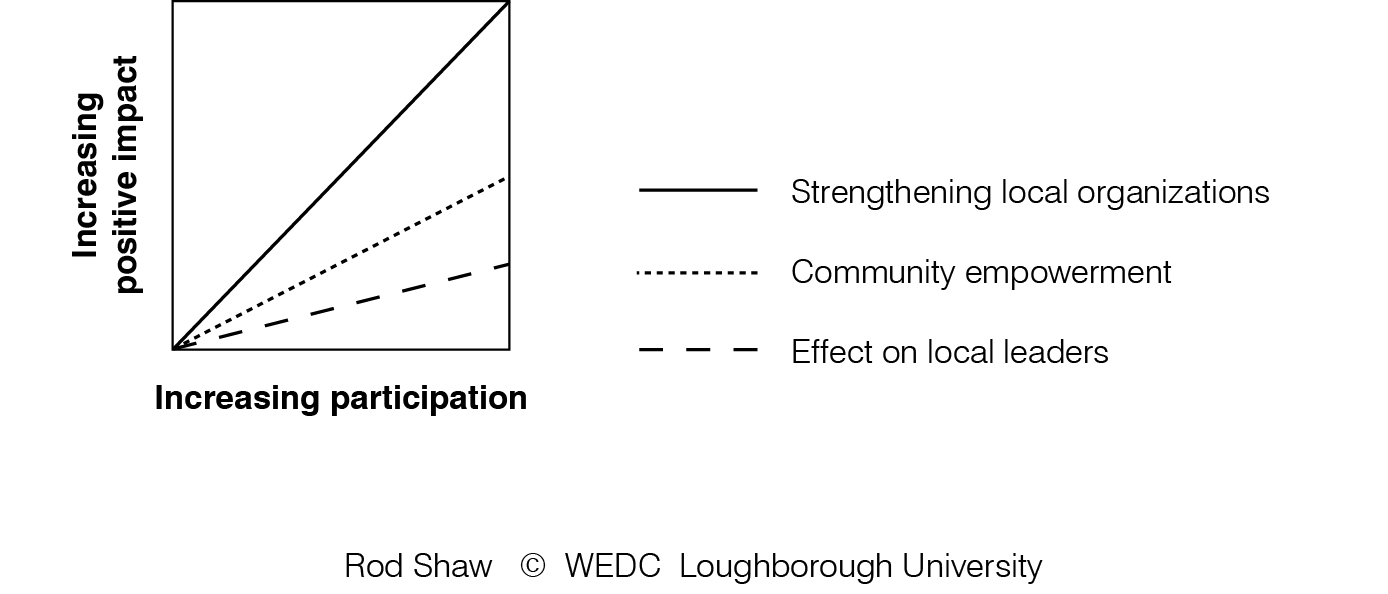
Project timescales | Reducing the number of management levels | Relationships between participation and impact on community organisations | ||
|
|

| ||
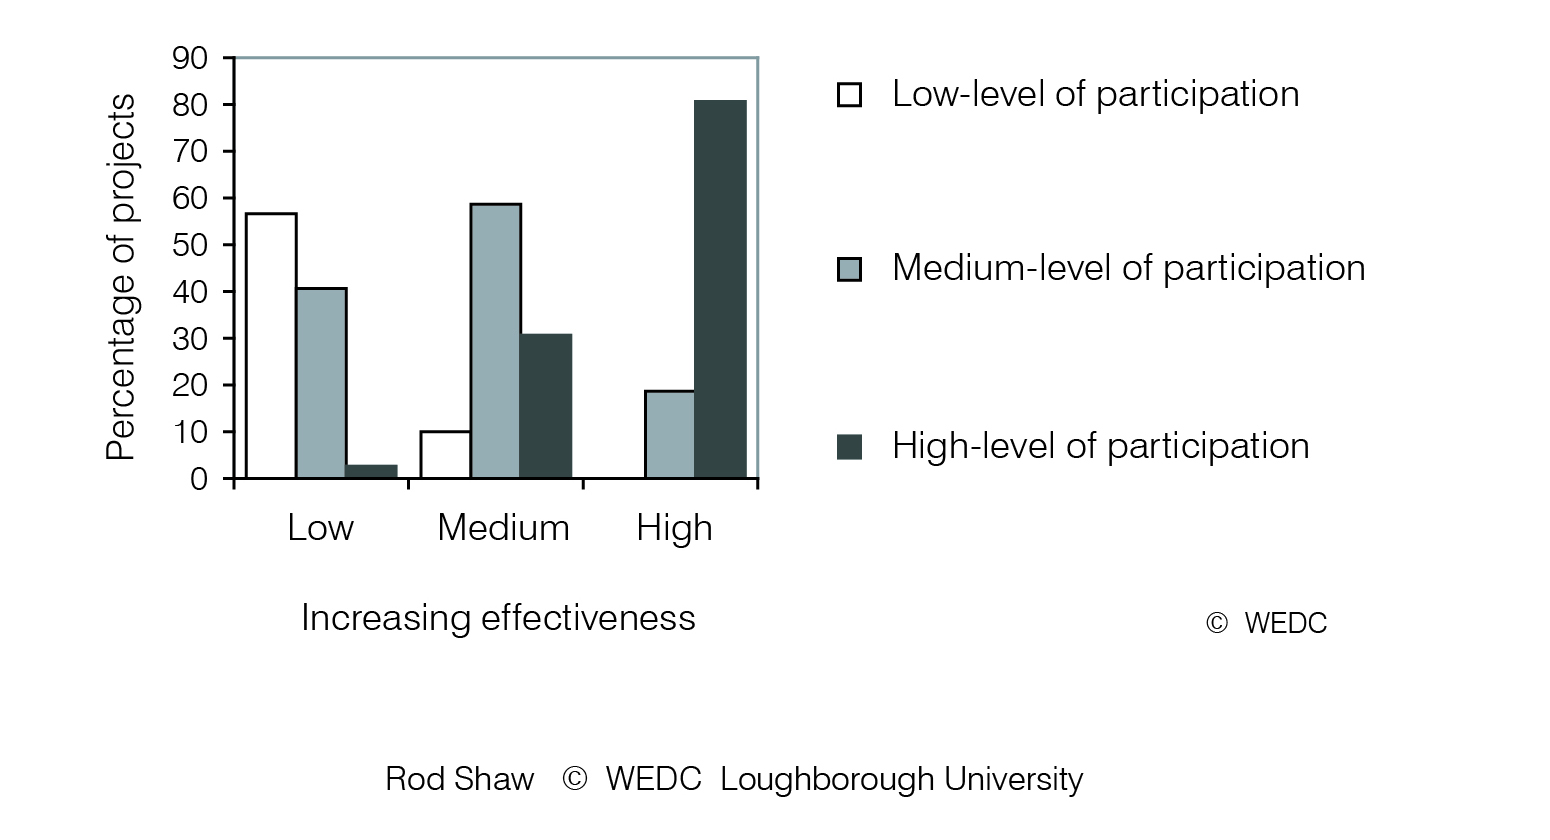
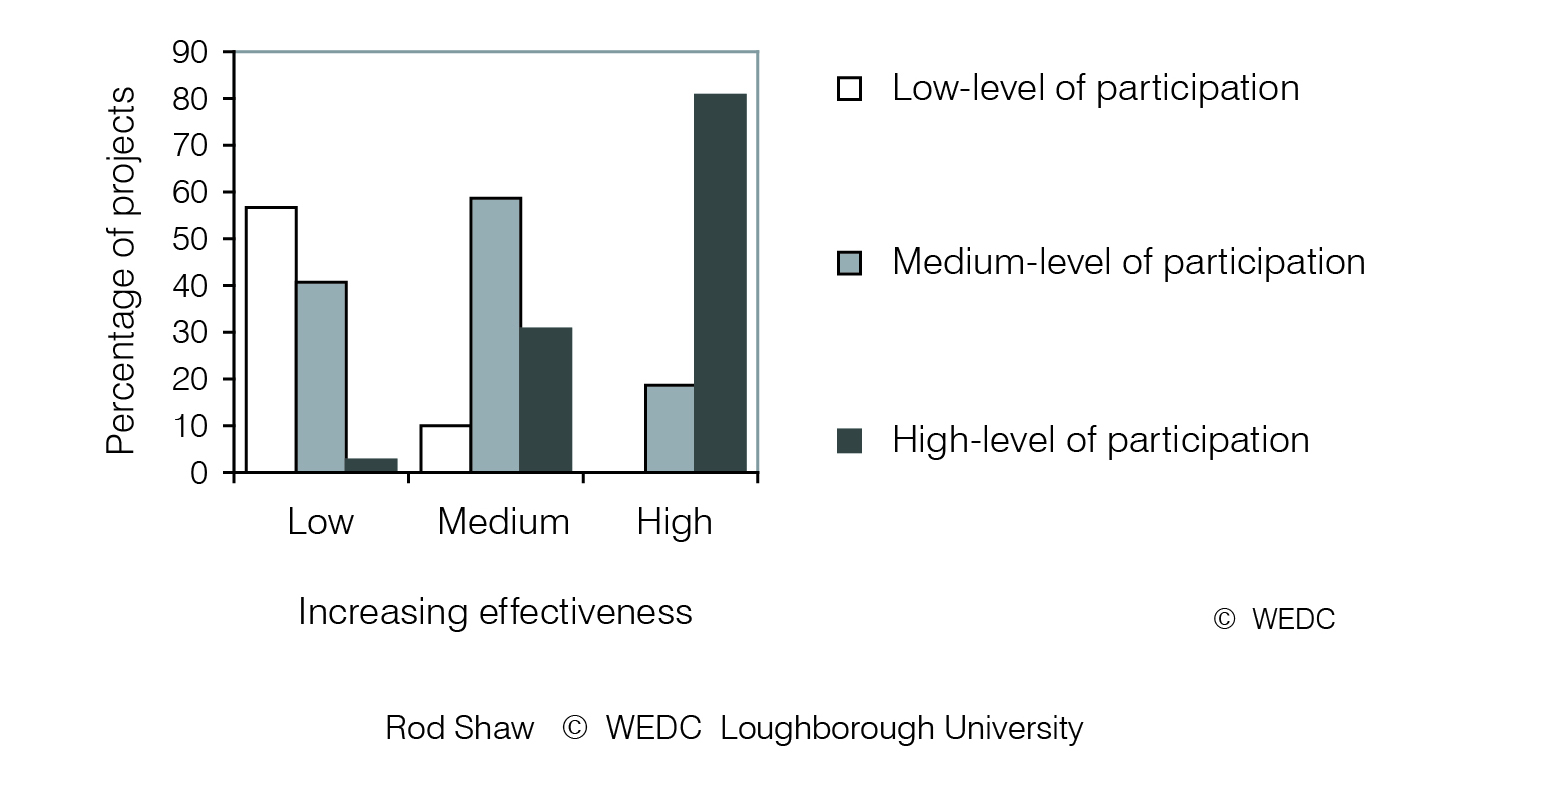
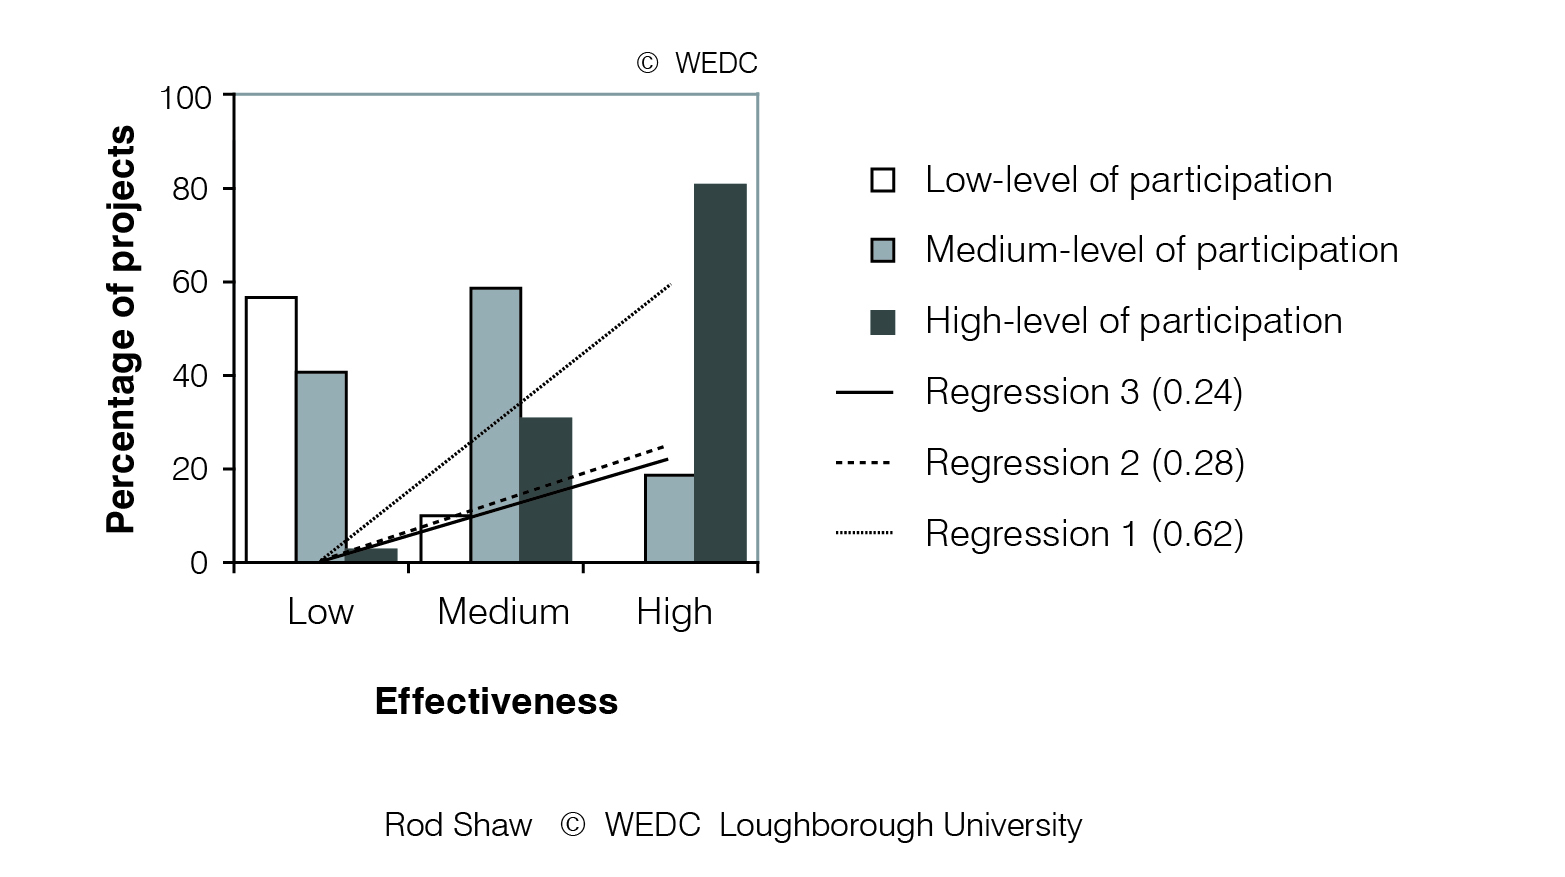
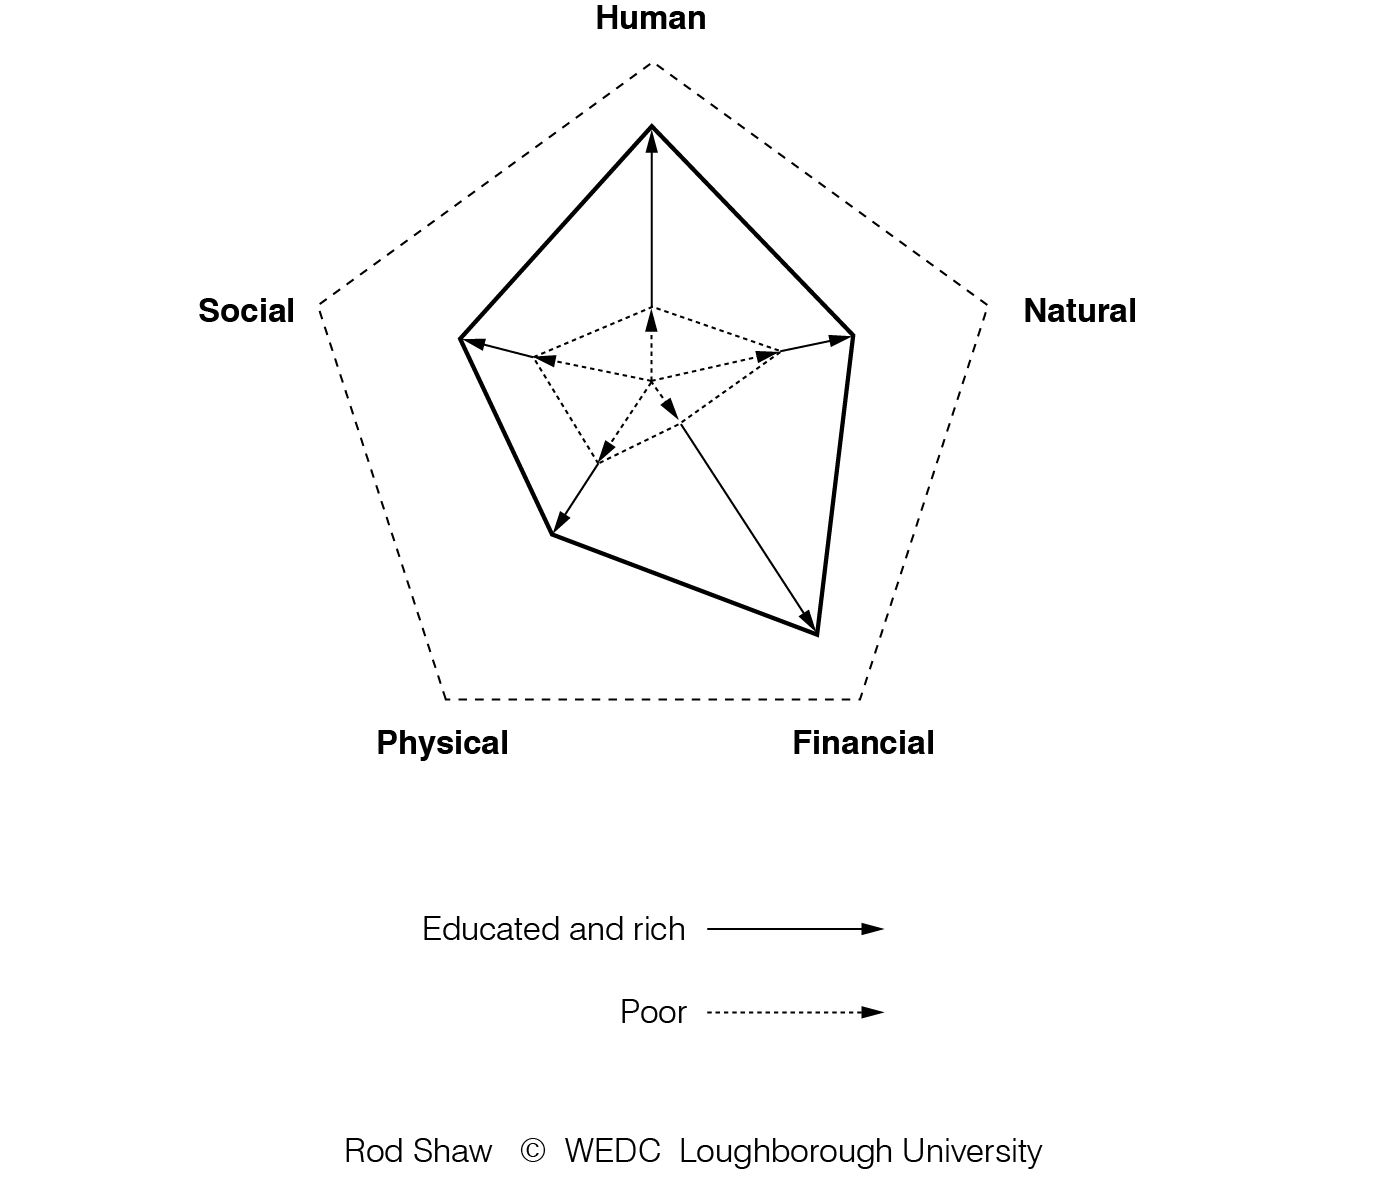
Relationship between project effectiveness and level of participation | Relative access to resources | Roads make a difference | ||
|

|
| ||
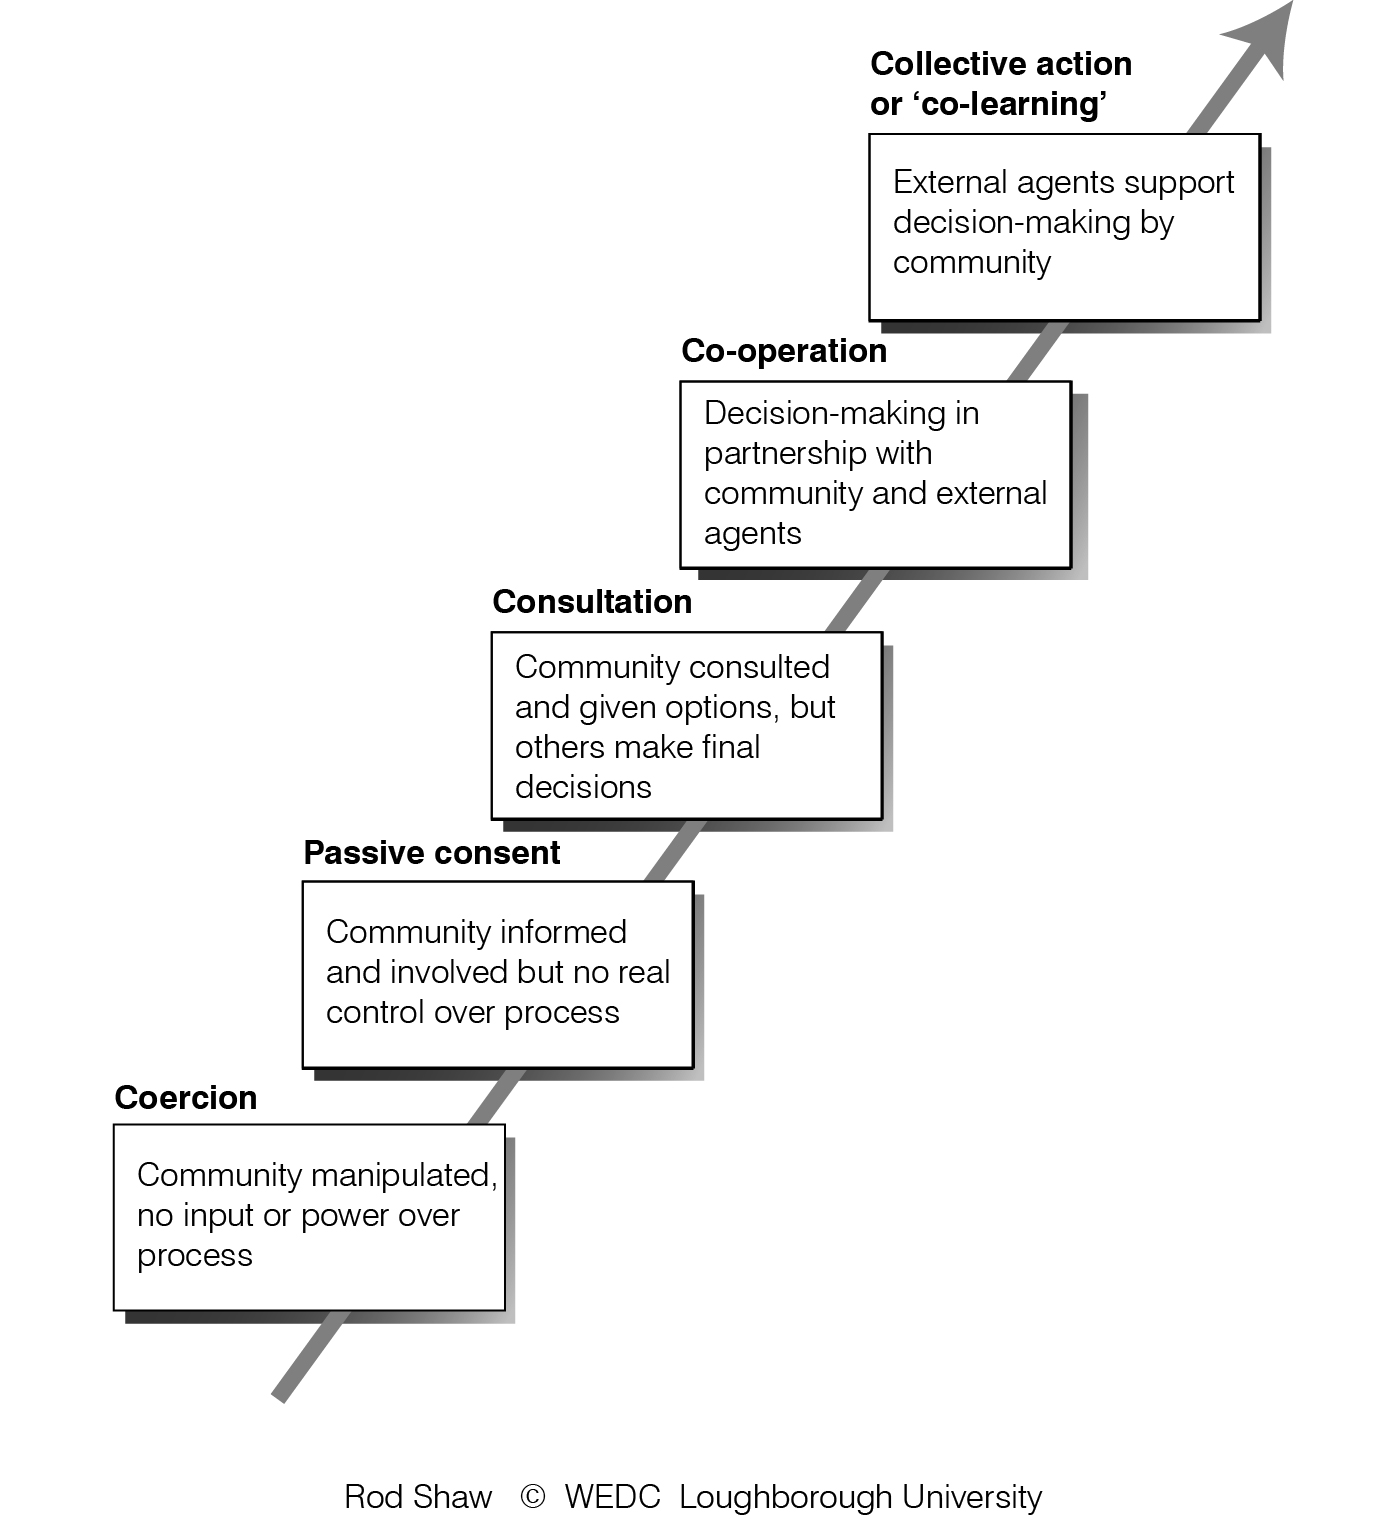
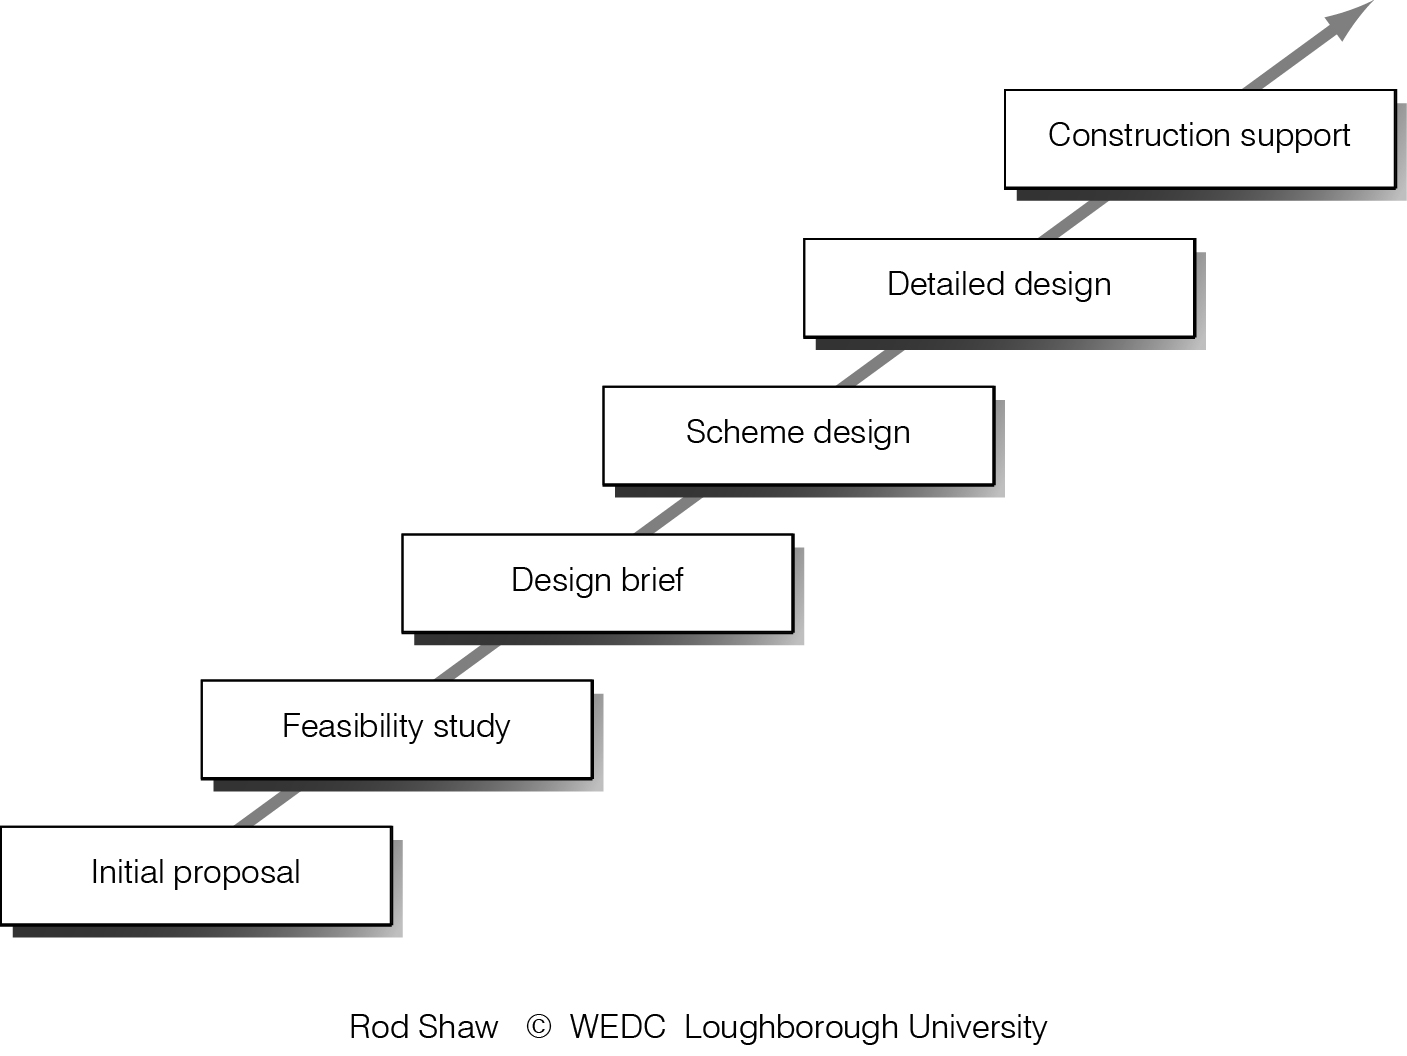
Scales of participation | Social practice and water quality | Stages in the development of project design | ||

|
|
| ||
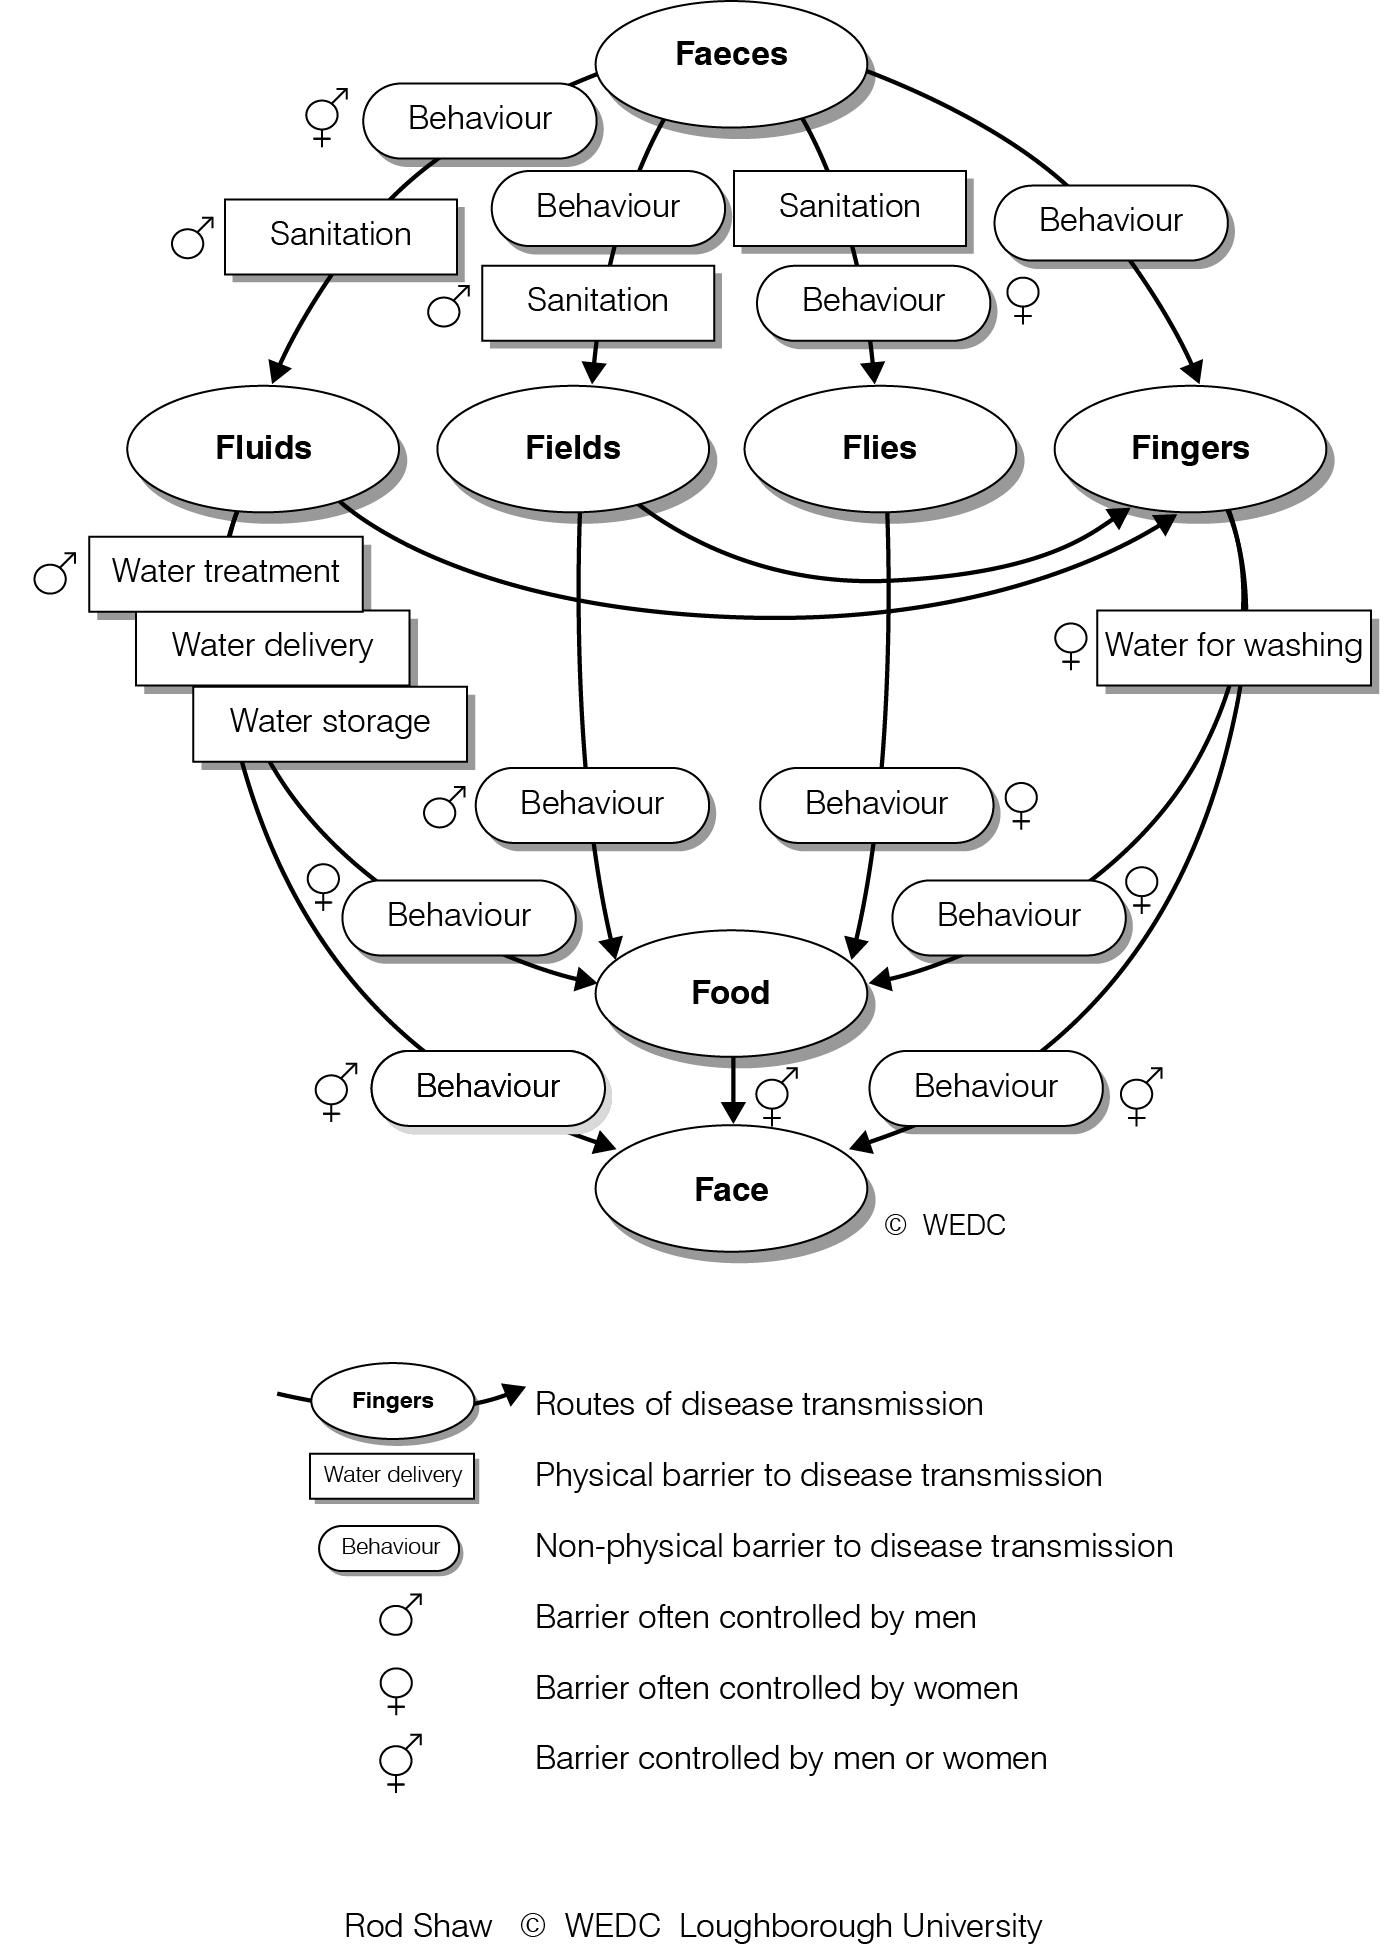
Supply and demand | Sustaining social change | The transfer of disease from faeces to mouth v1 | ||

|
|

| ||
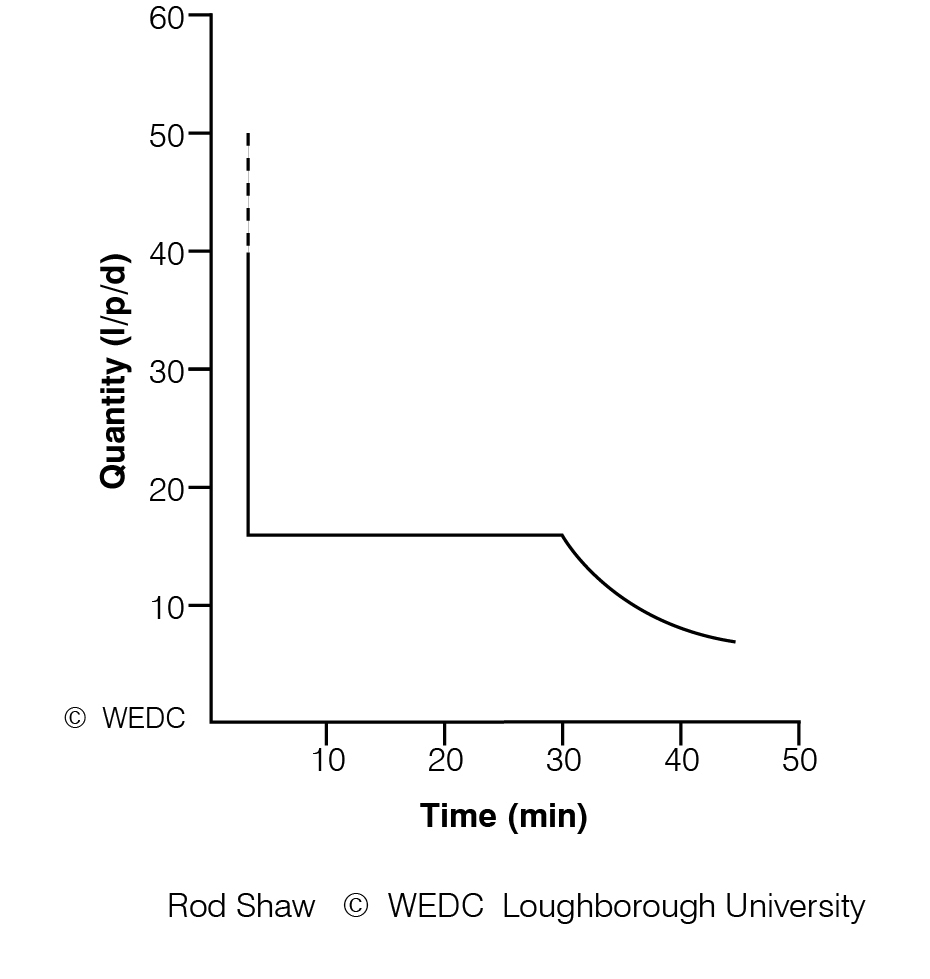
The transfer of disease from faeces to mouth v2 | Water consumption versus time for collection | What is beneath the surface | ||

|
| |||
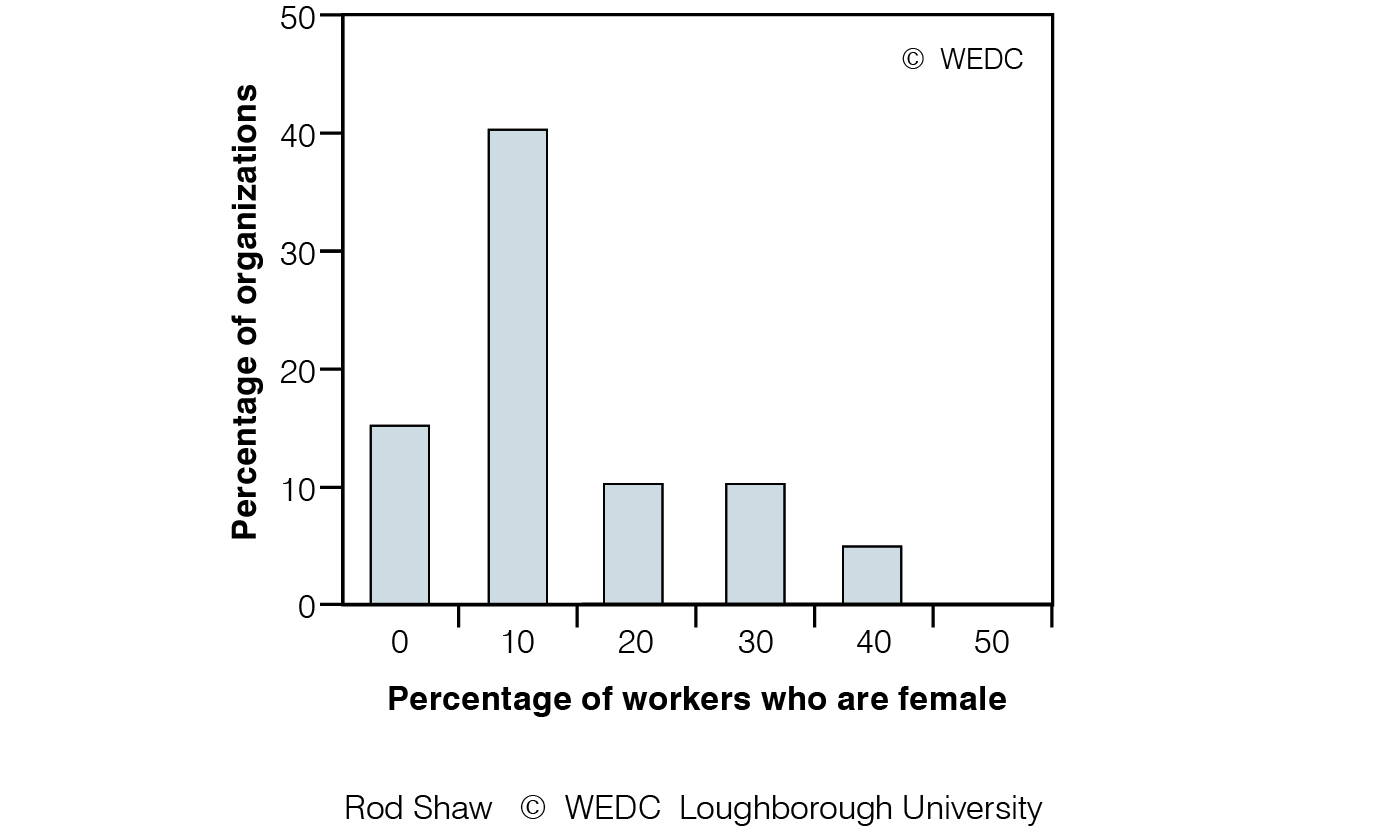
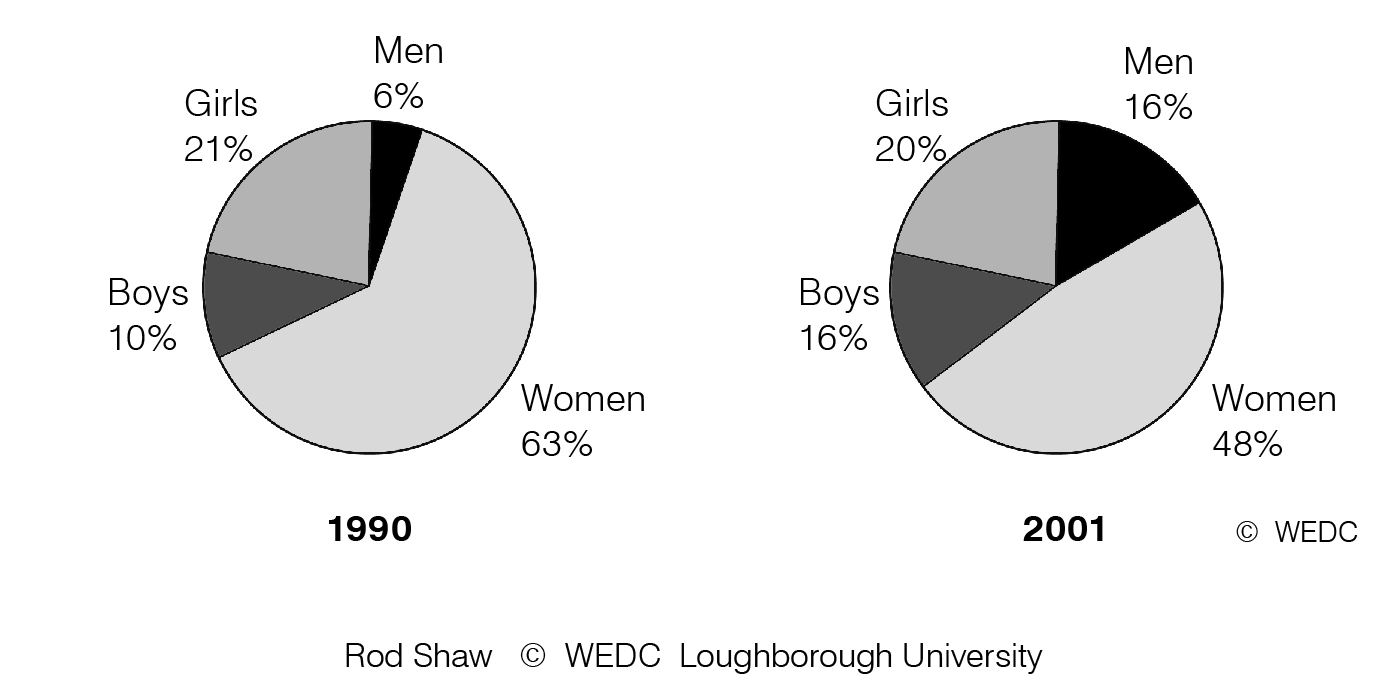
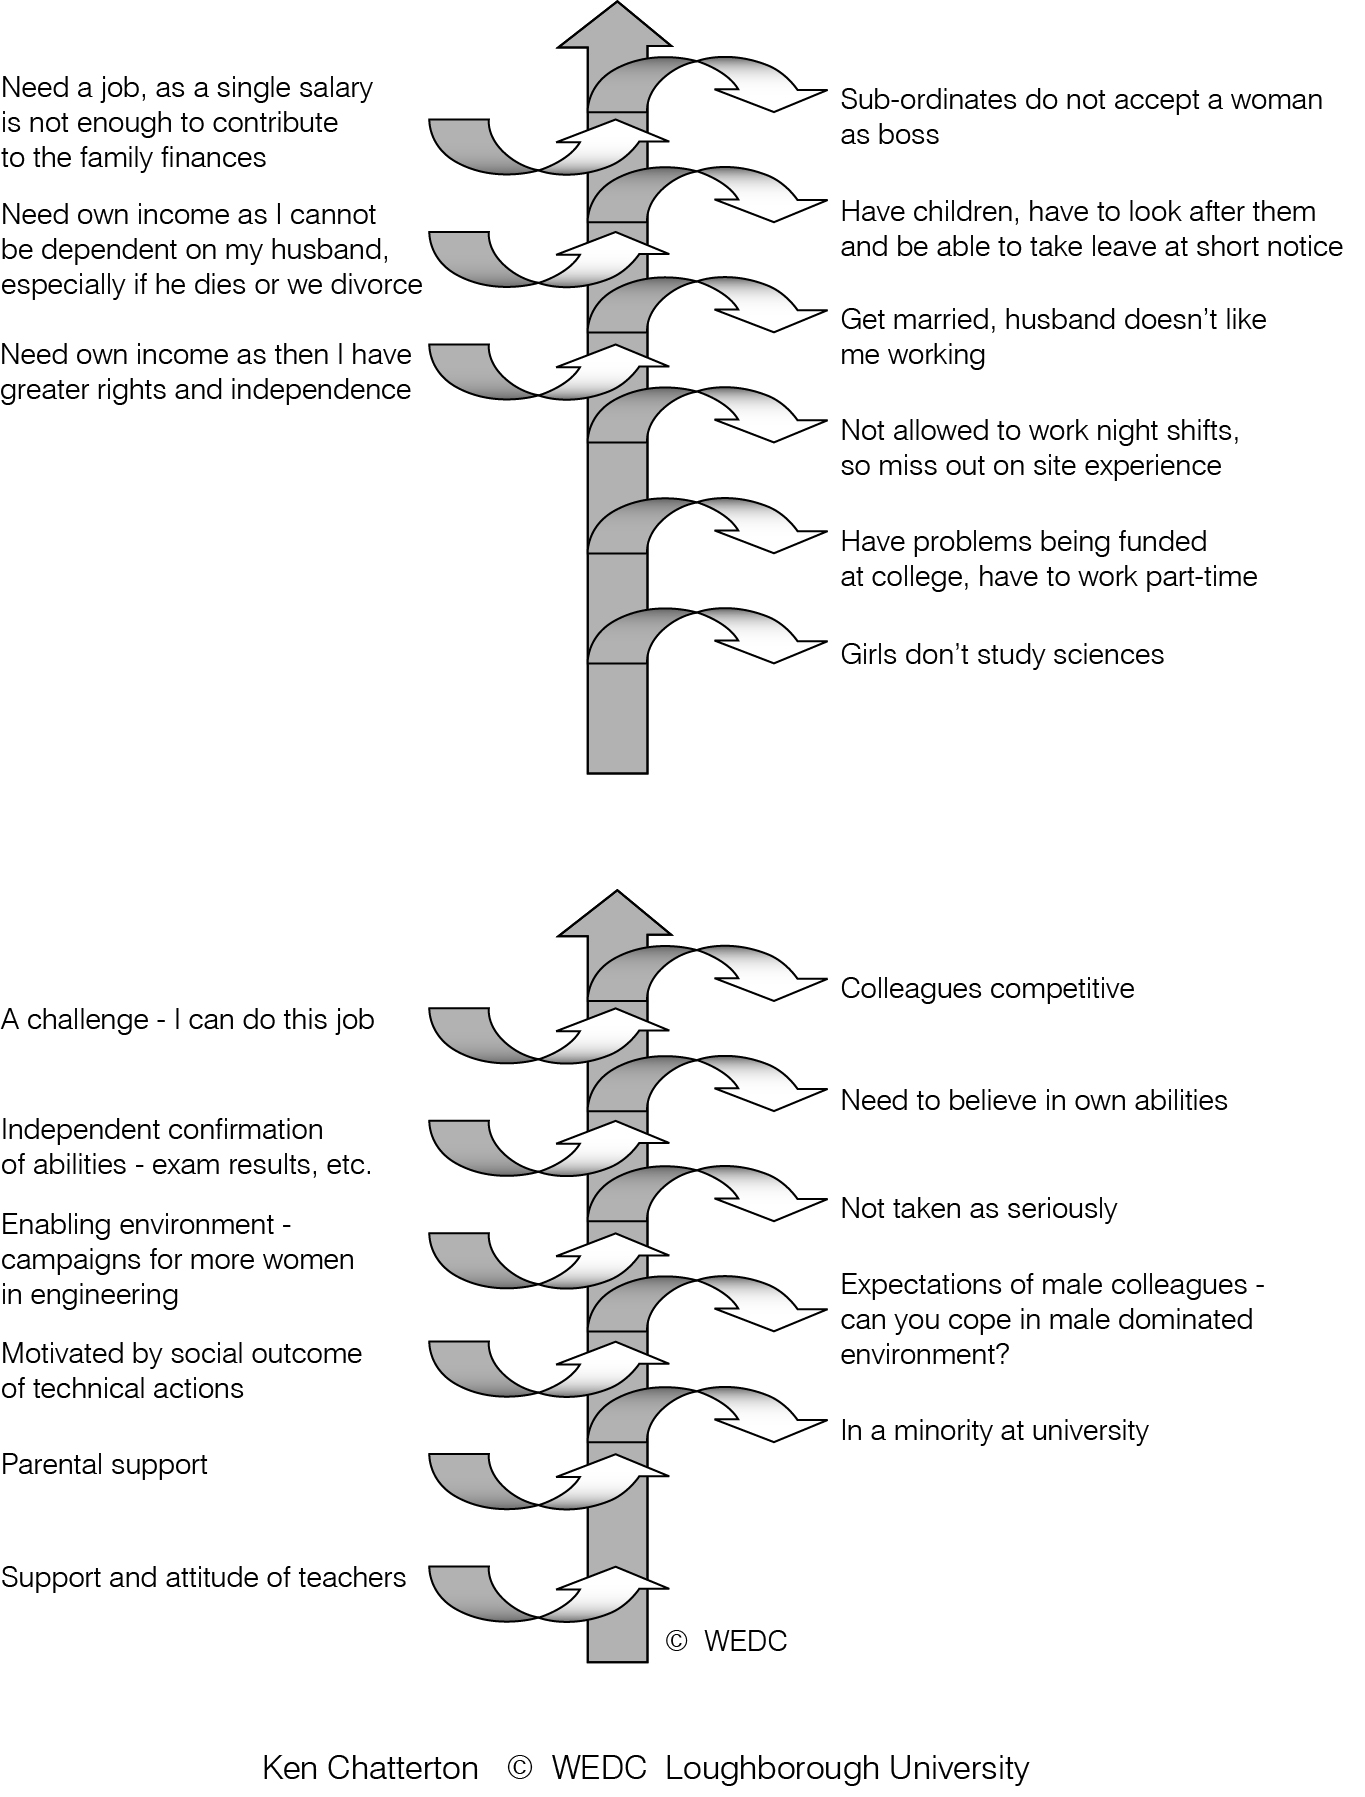
Who collects water | Why women enter and leave the profession |

© 2026 Loughborough University. All rights reserved.
My WEDC Terms & Conditions | Privacy Policy